Research · Modelling · Control · AI/ML · Generative AI · Digital twins

Modelling the physical world from data and physics — and building its digital twins

For two decades my research has asked one question at growing scale: how do we know what a physical system is doing, what it will do next — and how to control it — by combining physics, control theory and AI/machine learning with the data it gives us? From hydraulic presses, rotors and robots to jet engines, Li-ion batteries, buildings and grid-scale storage. Most recently, the same engineering discipline (strict interfaces, deterministic fallbacks, honest metrics) goes into generative AI that runs on an organisation’s own documents, without the data leaving the firewall.

1,015

citations

11

h-index

12

i10-index

70+

publications

20+ years6 countries7 research stagesSelected industrial case studiesVisiting researcher, ETH Zürich

Research atIIT DelhiKU LeuvenUniversity of SheffieldVUBDTUETH Zürich

Citations per year

Google Scholar · 2026 = year to date

2016: 11 citations11162017: 18 citations18172018: 60 citations60182019: 102 citations102192020: 115 citations115202021: 158 citations158212022: 103 citations103222023: 102 citations102232024: 102 citations102242025: 121 citations121252026: 110 citations11026

696 of 1,015 citations since 2021 — steady, lasting use of the work.

The thread through it all

  1. Model
  2. Control
  3. Estimate
  4. Diagnose
  5. Identify
  6. Learn (AI/ML)
  7. Quantify uncertainty
  8. Twin & deploy

Each stage of my career added one capability to the same chain — which is why today’s industrial AI and digital twins rest on twenty years of modelling, control, estimation, identification and machine learning on real physical systems — physics where it is known, data and AI/ML where it is not.

Industrial research & digital twins — selected case studies

What the research delivers today, newest first: generative AI behind the firewall, grid-scale batteries, gas turbines and generators — each published with colleagues and co-authors.

Enterprise AI: generative AI that stays behind the firewall

On-premise generative AI · Accepted · Innovations in Software Engineering Conference (ISEC) 2027

Prodeck: data-sovereign GenAI that builds slide decks from internal documents

Question
How do you get GenAI productivity without letting confidential strategy, financial and client data leave the firewall — and keep every slide grounded in the organisation’s own documents?
Approach
An air-gapped, open-weight pipeline — Plan, Ground, Generate, Render — that treats every LLM call as an unreliable subsystem behind a strict contract: per-slide hybrid retrieval (vector index, knowledge graph and domain aliases), 19 typed JSON schemas with validation and deterministic fallbacks, and deterministic rendering to branded slides. It runs on one on-premise server with two 16 GB GPUs.
Result
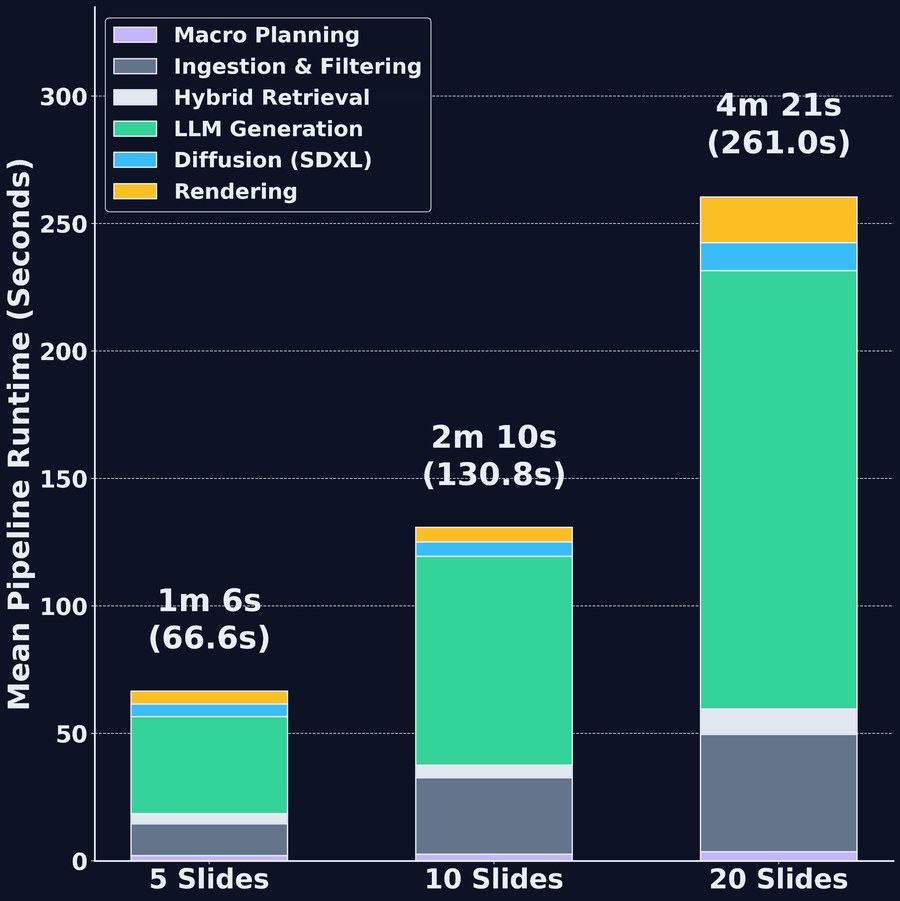
On a 150-task benchmark: 5–20-slide decks in about 1–4 minutes, 95% schema-valid at the first attempt, and a median grounding score of 0.865 with hybrid retrieval, against 0.548 with vectors alone and 0.422 with the graph alone.

1–4 min

for a 5–20-slide deck (150-task benchmark)

95%

of decks schema-valid at the first attempt

0.865

median grounding score with hybrid retrieval (vector-only 0.548)
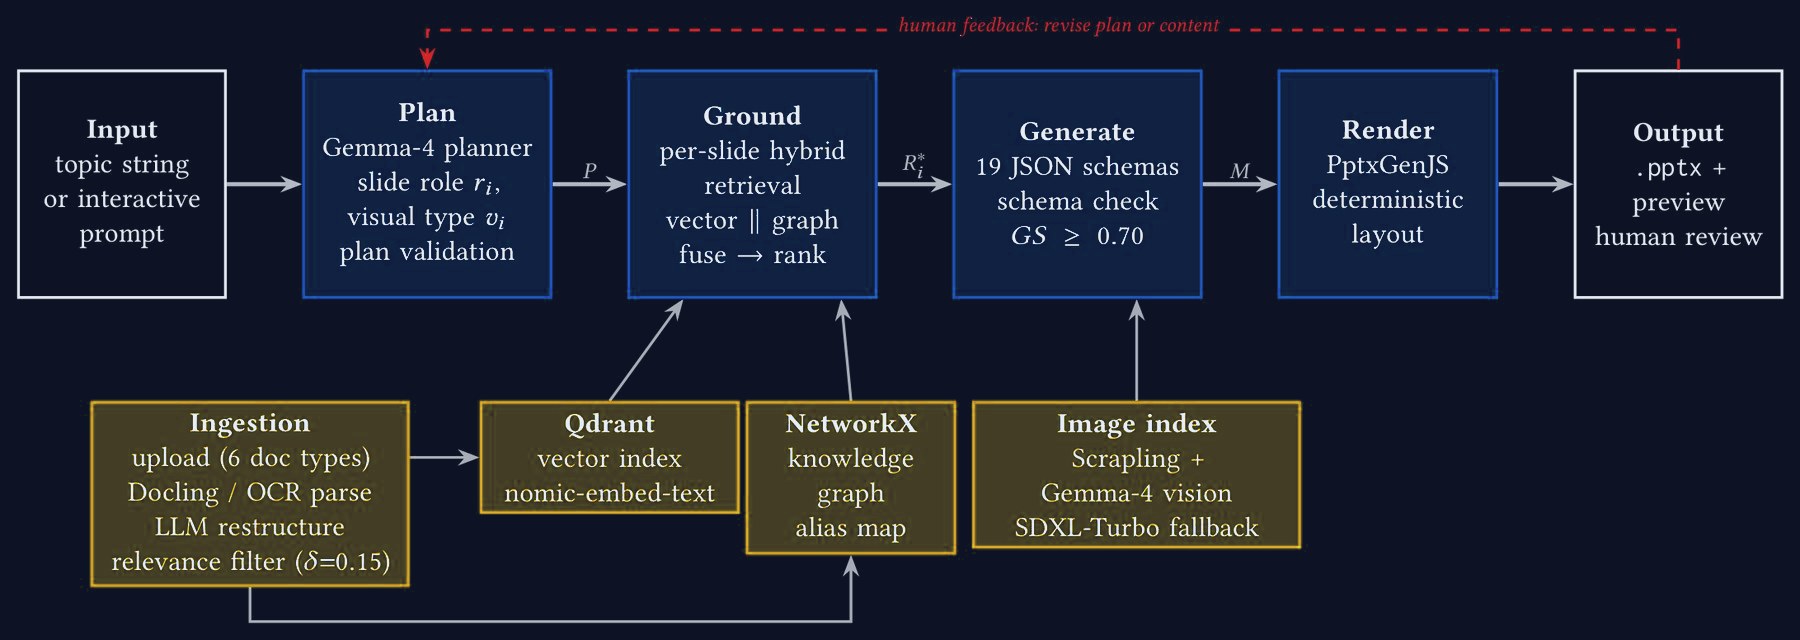
Prodeck workflow: Plan → Ground → Generate → Render, fed by document ingestion, a vector index, a knowledge graph and an image index. The whole pipeline runs on an air-gapped on-premise server, and people review the output.
Prodeck workflow: Plan → Ground → Generate → Render, fed by document ingestion, a vector index, a knowledge graph and an image index. The whole pipeline runs on an air-gapped on-premise server, and people review the output. Adapted from Relan with Rastogi, Goyal, D. Relan & Kumar, Industry Innovation Track, 20th Innovations in Software Engineering Conference (ISEC 2027), Association for Computing Machinery (ACM) India, Sardar Patel Institute of Technology, Mumbai (accepted).
Mean runtime by stage for 5-, 10- and 20-slide decks: LLM generation dominates, while planning, retrieval, image generation and rendering stay small.
Mean runtime by stage for 5-, 10- and 20-slide decks: LLM generation dominates, while planning, retrieval, image generation and rendering stay small. Adapted from Relan with Rastogi, Goyal, D. Relan & Kumar, Industry Innovation Track, 20th Innovations in Software Engineering Conference (ISEC 2027), Association for Computing Machinery (ACM) India, Sardar Patel Institute of Technology, Mumbai (accepted).

Relan with Rastogi, Goyal, D. Relan & Kumar, Industry Innovation Track, 20th Innovations in Software Engineering Conference (ISEC 2027), Association for Computing Machinery (ACM) India, Sardar Patel Institute of Technology, Mumbai (accepted) · conference page
Battery storage: five questions a battery can’t answer alone

  1. 1 · How old am I?
  2. 2 · How hot will I get?
  3. 3 · Is something going wrong?
  4. 4 · Can the answer arrive, and be trusted?
  5. 5 · What should I do?

Question 1 · how old am I?

State of health from a partial charge

Question ·
We cannot open a cell in the field — can its health be estimated from ordinary partial charging?
Approach ·
Incremental-capacity features and Gaussian-process regression, with calibrated prediction intervals.
Result ·
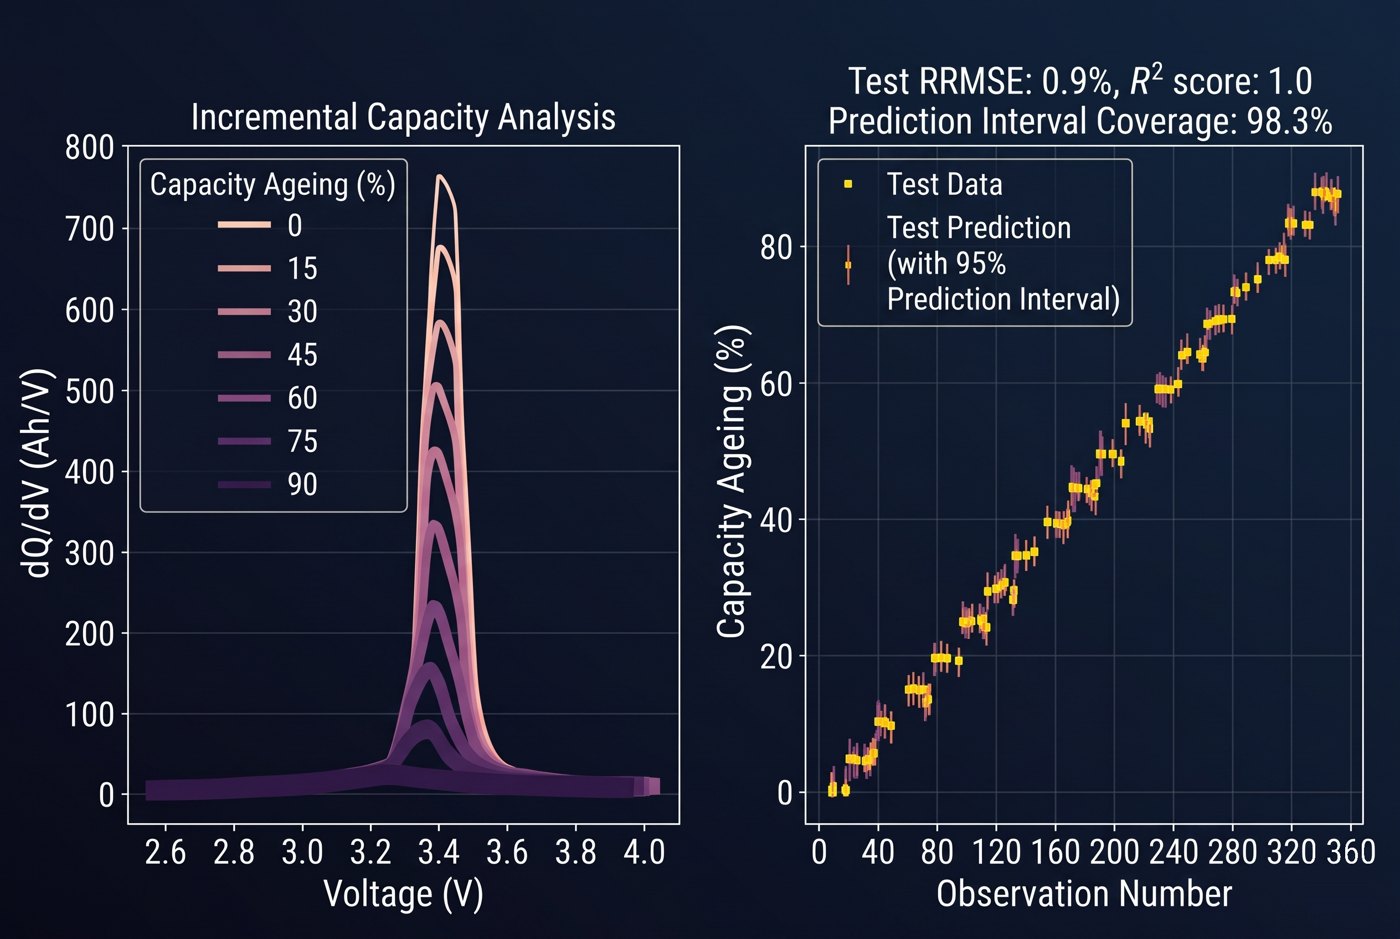
0.9% test error and 98.3% interval coverage (validated LFP cell model).

Brahma & Relan, IEEE NPSC 2024

Incremental-capacity analysis: the dQ/dV peak falls as capacity ageing rises from 0 to 90%; test predictions of capacity ageing with 95% prediction intervals (test RRMSE 0.9%, interval coverage 98.3%).
Incremental-capacity analysis: the dQ/dV peak falls as capacity ageing rises from 0 to 90%; test predictions of capacity ageing with 95% prediction intervals (test RRMSE 0.9%, interval coverage 98.3%). Adapted from Brahma & Relan, IEEE NPSC 2024.

Question 1 · how old am I? · New 2026

Robust state of health: fusing cycle counting with incremental-capacity features

Question ·
Field telemetry is sparse and noisy, and full charge cycles are rare — how do you estimate state of health robustly, with honest uncertainty, and does it help the battery management system?
Approach ·
Two Gaussian-process models: a mixed-effects GPR on equivalent full cycles that separates fleet-level ageing from cell-specific variation, and a GPR on incremental-capacity features extracted from partial charges with automated filtering — fused by uncertainty-aware weighting.
Result ·
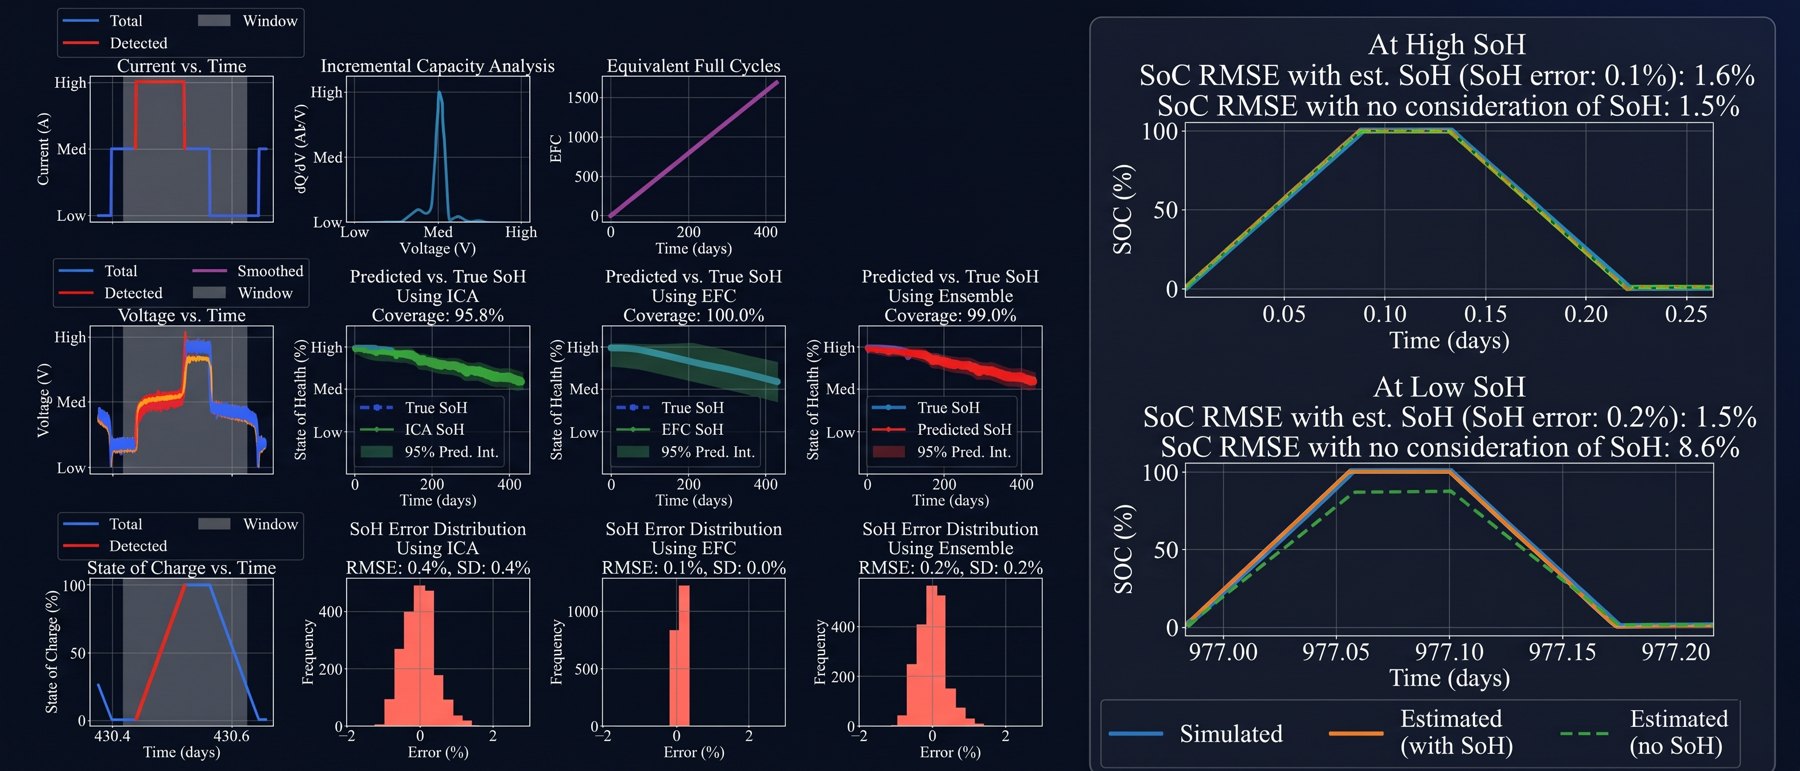
State-of-health RMSE below 0.5% across test scenarios; feeding the estimate into an extended Kalman filter cut late-life state-of-charge error from 8.6% to 1.5%.

<0.5%

state-of-health RMSE across test scenarios

8.6% → 1.5%

late-life state-of-charge error, without vs with the SoH estimate

99%

coverage of the ensemble’s 95% prediction interval

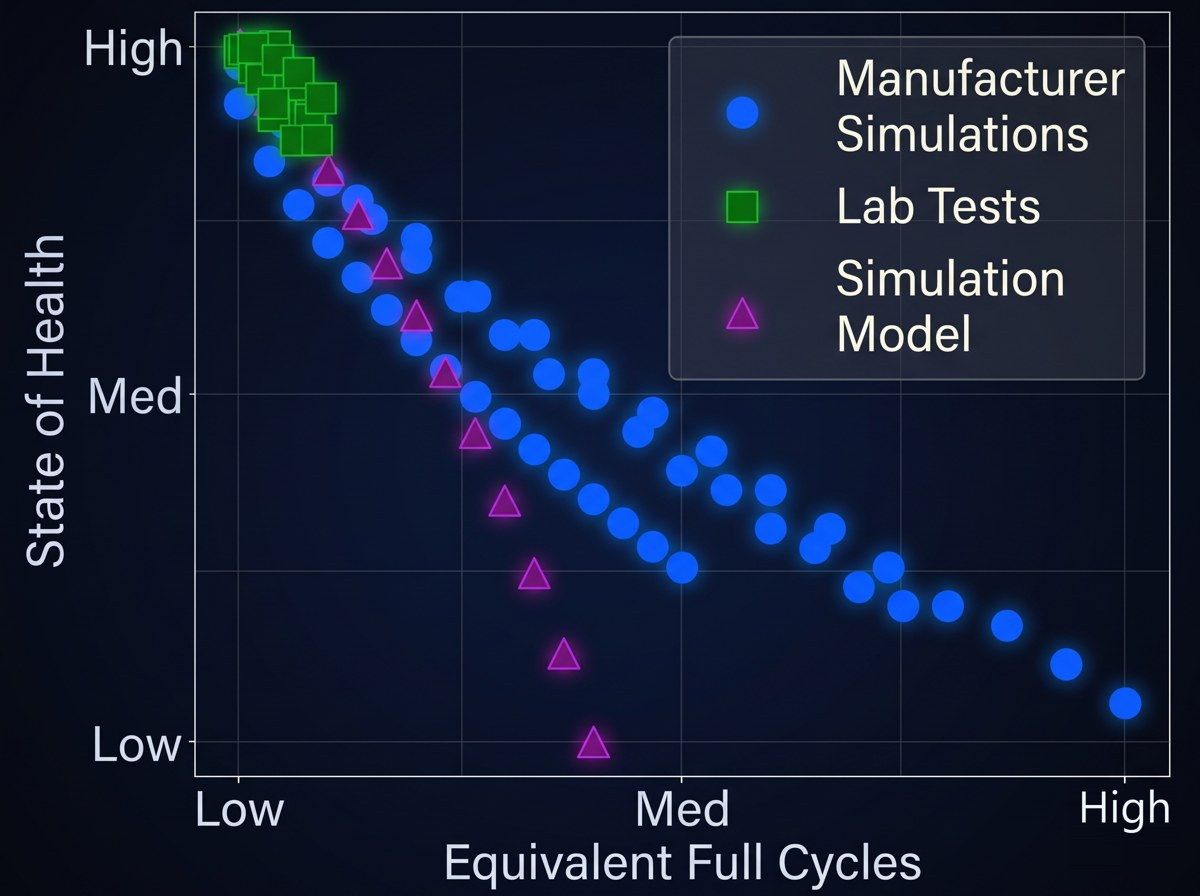
The problem: ageing data from manufacturer simulations, lab tests and a simulation model diverge — the mixed-effects GPR separates the shared trend from source-specific deviations. Fig. 1, © 2026 Elsevier; values shown as Low/Med/High for confidentiality.
Left: the ensemble state-of-health estimator on simulated ageing data — incremental-capacity (ICA), equivalent-full-cycle (EFC) and fused estimates with 95% prediction intervals and error distributions. Right: state-of-charge estimation with and without the updated state of health. Figures 11 and 13 reproduced from Brahma & Relan, J. Energy Storage 180 (2026) 124185, © 2026 Elsevier.

Brahma & Relan, Journal of Energy Storage 180 (2026) 124185 · doi:10.1016/j.est.2026.124185

Question 1 · power fade

Power fade, a thread from my PhD

Question
Can power fade be tracked with measurements light enough for an edge device?
Approach
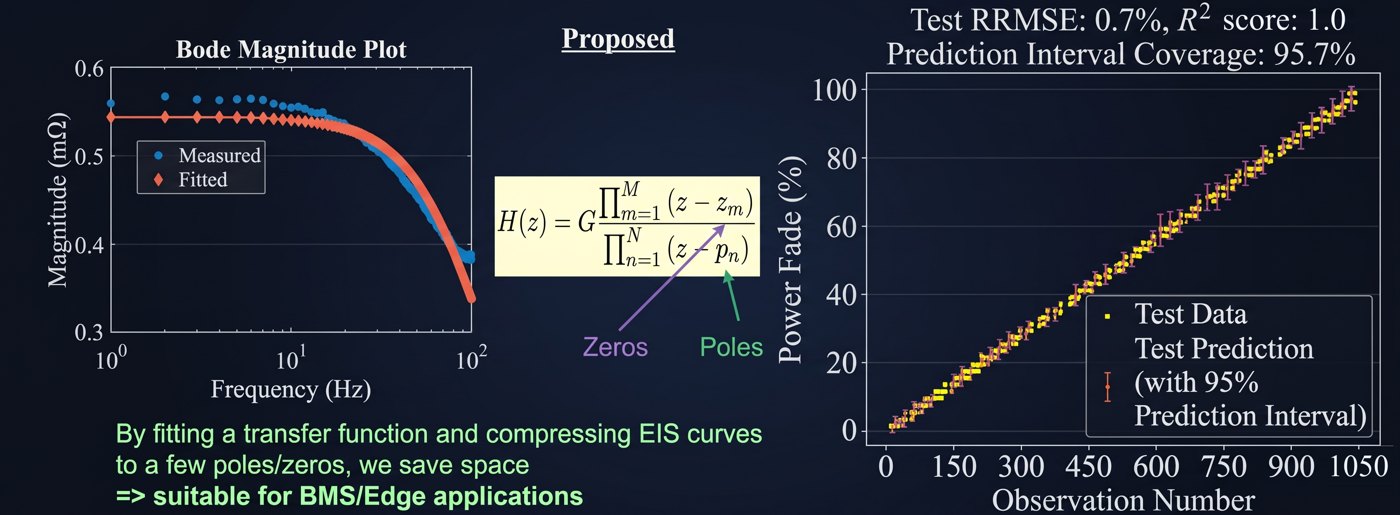
Compressing impedance curves into a few poles and zeros with multisine excitation — system identification from my PhD.
Result
0.7% test error and 95.7% interval coverage.
Impedance (EIS) curves compressed into a transfer function with a few poles and zeros — small enough for a BMS or edge device — and power-fade predictions with 95% prediction intervals (test RRMSE 0.7%, interval coverage 95.7%).
Impedance (EIS) curves compressed into a transfer function with a few poles and zeros — small enough for a BMS or edge device — and power-fade predictions with 95% prediction intervals (test RRMSE 0.7%, interval coverage 95.7%). Adapted from Brahma & Relan, Indian Control Conference 2024.

Brahma & Relan, Indian Control Conference 2024

Question 2 · how hot will I get?

A high-fidelity electro-thermal twin

Question
Heat and chemistry drive each other — how good can a coupled model be, and where does it stop being right?
Approach
Coupled electrochemical and thermal models, with parameters tuned in stages by sensitivity.
Result
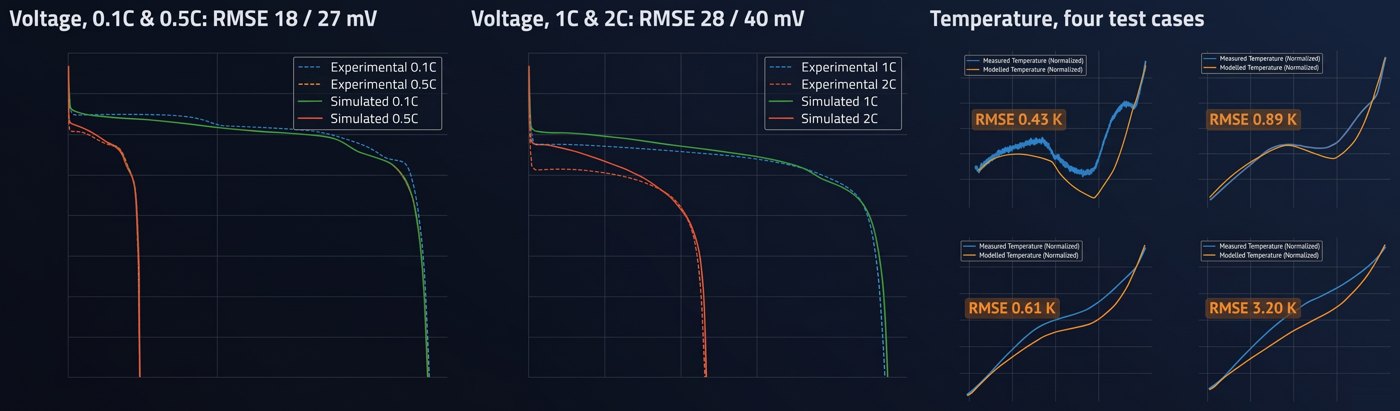
Voltage error 18–40 mV (0.1C–2C); temperature error 0.43–0.89 K in three cases and 3.2 K in the fourth.
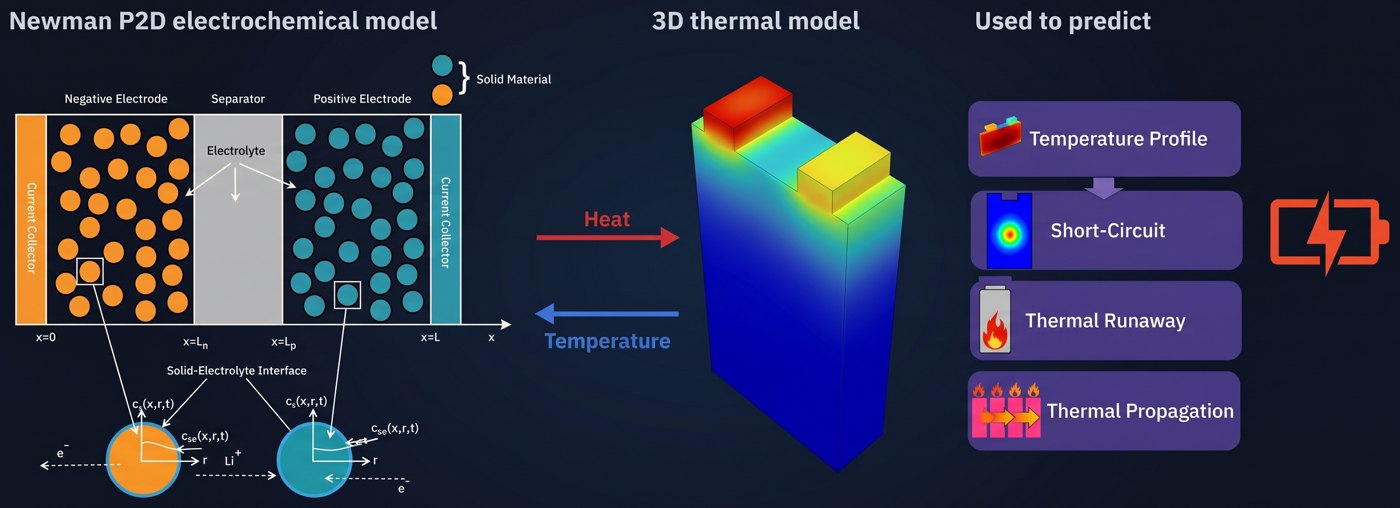
Coupled electrochemical–thermal model: a Newman pseudo-two-dimensional (P2D) electrochemical model exchanges heat and temperature with a 3D thermal model of the cell, to predict temperature profiles, short circuits, thermal runaway and its propagation.
Coupled electrochemical–thermal model: a Newman pseudo-two-dimensional (P2D) electrochemical model exchanges heat and temperature with a 3D thermal model of the cell, to predict temperature profiles, short circuits, thermal runaway and its propagation. Adapted from Tripathi & Relan, iNCMDAO 2024.
Validation against measurements: terminal voltage at 0.1C–2C (RMSE 18–40 mV) and normalised temperature in four test cases (RMSE 0.43–3.20 K).
Validation against measurements: terminal voltage at 0.1C–2C (RMSE 18–40 mV) and normalised temperature in four test cases (RMSE 0.43–3.20 K). Adapted from Tripathi & Relan, iNCMDAO 2024.

Tripathi & Relan, iNCMDAO 2024

Question 3 · is something going wrong?

Anomalies without labelled failures

Question ·
Real battery failures are rare and seldom shared — how do you detect them early?
Approach ·
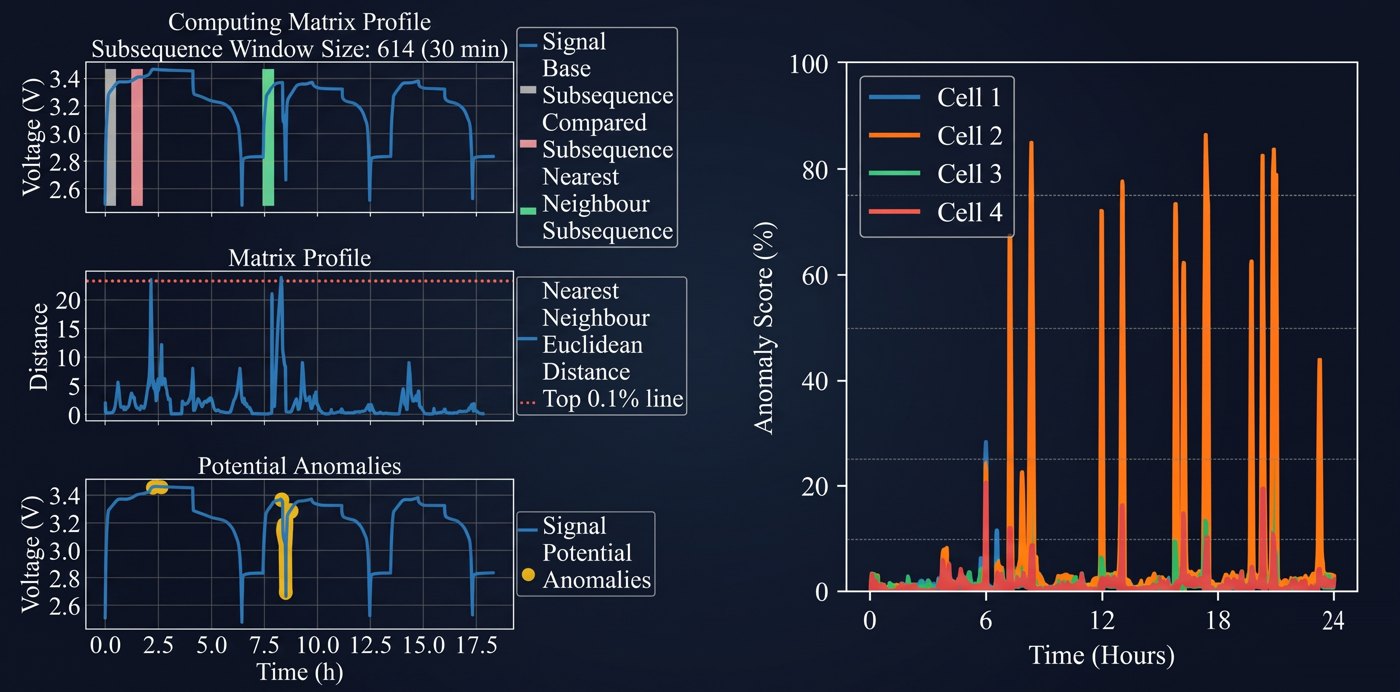
Matrix profile, statistical scoring and time-delay-embedding clustering, with a cell-and-module double check to cut false alarms.
Result ·
Best Paper Award, IEEE SEFET 2025 (BAT-TEC).

Brahma & Relan (BAMM) and Chopra, Brahma & Relan (BAT-TEC), IEEE SEFET 2025

Matrix profile on cell voltage: subsequences are compared with their nearest neighbours, distances above the top-0.1% line flag potential anomalies; right, anomaly scores per cell over 24 hours.
Matrix profile on cell voltage: subsequences are compared with their nearest neighbours, distances above the top-0.1% line flag potential anomalies; right, anomaly scores per cell over 24 hours. Adapted from Brahma & Relan (BAMM) and Chopra, Brahma & Relan (BAT-TEC), IEEE SEFET 2025.

Question 3 · is something going wrong? · Accepted · Indian Control Conference (ICC) 2027

PADDED: matching live signals against a compact library of normal behaviour

Question
Battery faults are rare and labelled examples scarce, and online monitoring needs a verdict on every new window of data — can a small library of normal patterns provide it?
Approach
A parsimonious reference database built from simulations of a commercially validated cell model and six months of field data from a BESS test facility in Germany: a new snippet is stored only if it differs from everything already stored. Each incoming window is z-normalised, matched to its closest reference, aligned for offset and timing (dynamic time warping) and turned into an anomaly score around a distance threshold.
Result
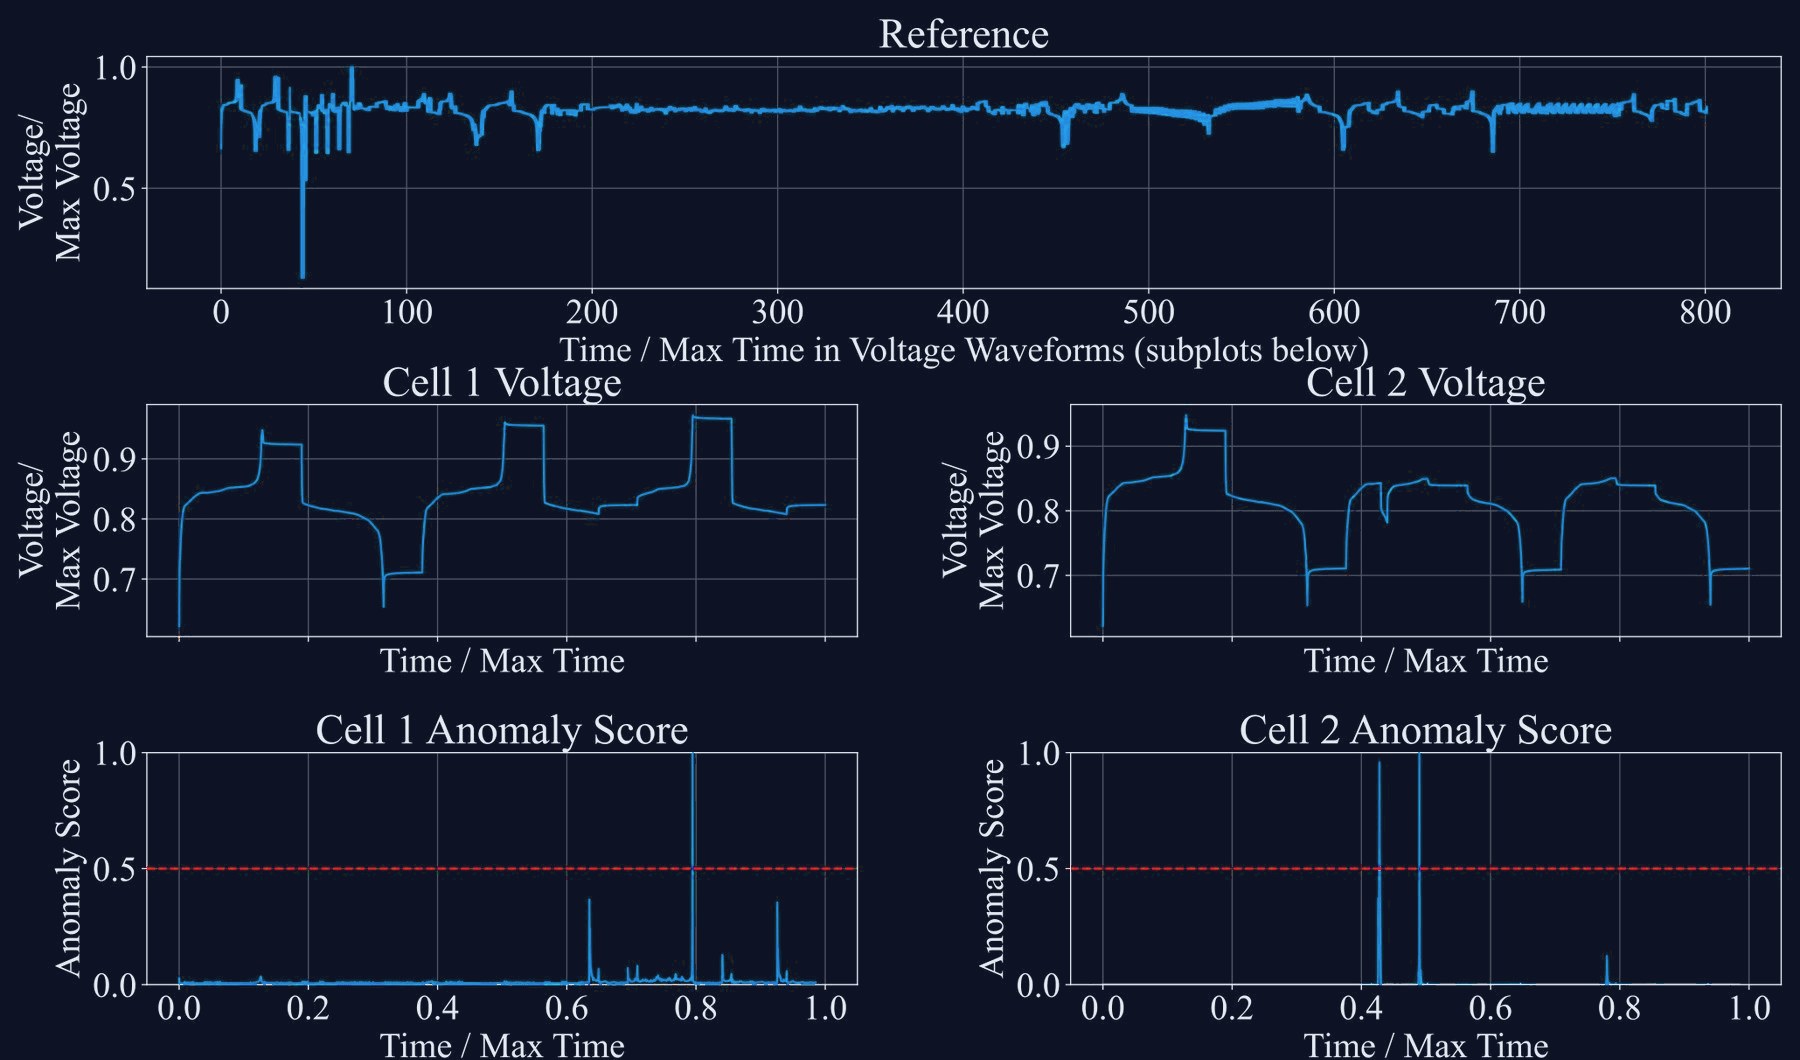
On an independent simulated 4S LFP module with an induced internal short circuit, the score of the affected cell spikes at the fault and stays low during normal charge and discharge — with low computational overhead, suited to real-time monitoring.

56%

of candidate subsequences kept in the example reference database (2,488 of 4,450)

6 months

of BESS field data, plus simulations of a validated cell model

4S · 105 Ah

LFP test module with an induced internal short circuit

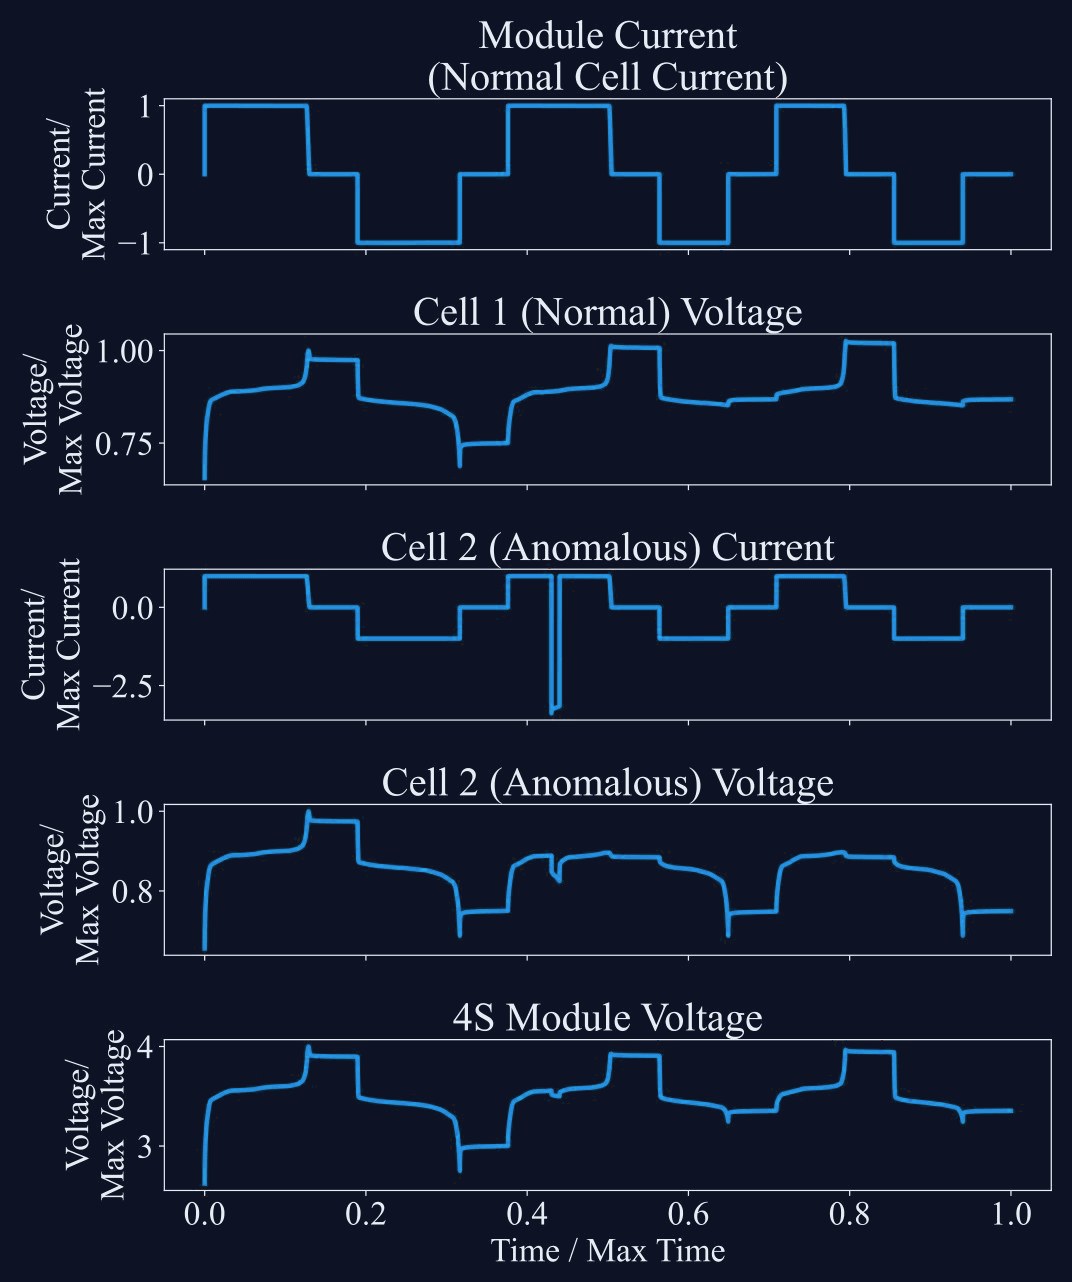
The test case: a short circuit across cell 2 of a 4S module reverses its current to almost three times the charging current and pulls its voltage down, while cell 1 keeps its normal charge–rest–discharge pattern. Values normalised for confidentiality.
The test case: a short circuit across cell 2 of a 4S module reverses its current to almost three times the charging current and pulls its voltage down, while cell 1 keeps its normal charge–rest–discharge pattern. Values normalised for confidentiality. Adapted from Brahma & Relan, Twelfth Indian Control Conference (ICC 2027), Indian Institute of Technology (IIT) Kharagpur, India (accepted).
Detection: the parsimonious reference database (top) and the voltage and anomaly score of cells 1 and 2 (cells 3 and 4 behave like cell 1). Cell 2’s score crosses 0.5 at the short circuit; the excursions near 0.8 in all cells come from a charging segment unlike the constant-current charging the database was built from. Values normalised for confidentiality.
Detection: the parsimonious reference database (top) and the voltage and anomaly score of cells 1 and 2 (cells 3 and 4 behave like cell 1). Cell 2’s score crosses 0.5 at the short circuit; the excursions near 0.8 in all cells come from a charging segment unlike the constant-current charging the database was built from. Values normalised for confidentiality. Adapted from Brahma & Relan, Twelfth Indian Control Conference (ICC 2027), Indian Institute of Technology (IIT) Kharagpur, India (accepted).

Brahma & Relan, Twelfth Indian Control Conference (ICC 2027), Indian Institute of Technology (IIT) Kharagpur, India (accepted) · conference page
Question 4 · can the answer arrive?

Analytics at the edge, next to deterministic control

Question
An accurate model is useless if its answer arrives late or corrupted — can edge analytics keep pace with the plant controller?
Approach
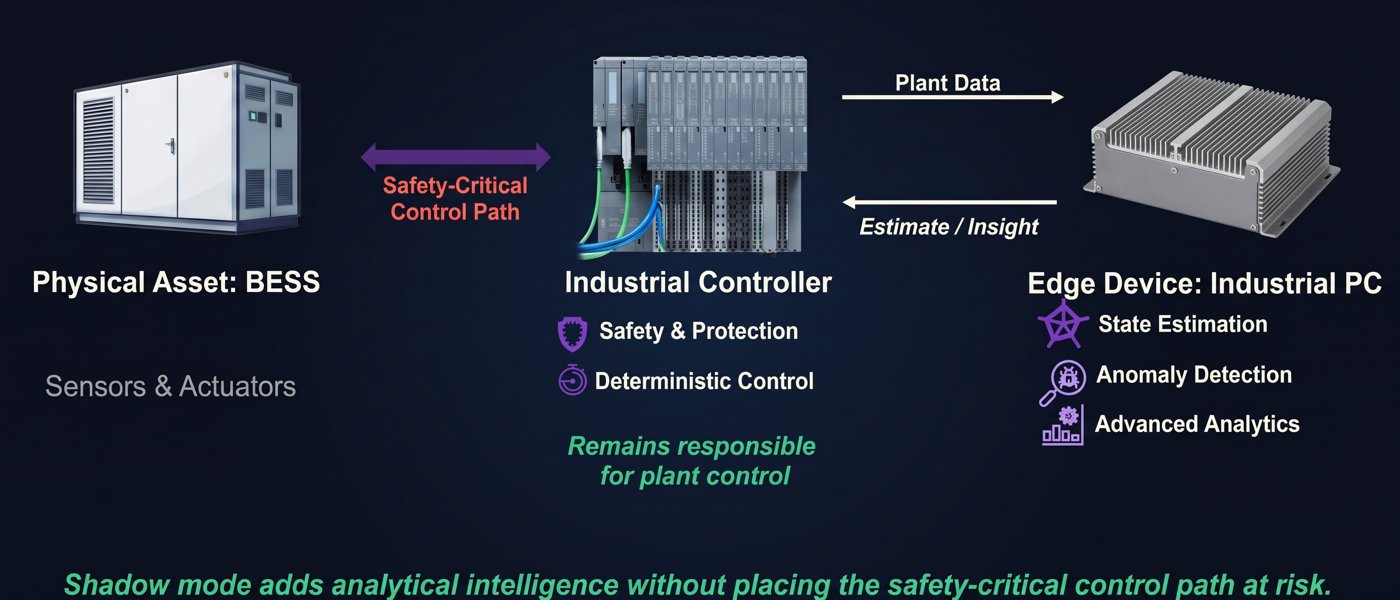
Shadow-mode edge analytics beside the trusted control path; separate replying from computing; a common heartbeat and a fail-and-warn policy.
Result
About 700 ms mean data cycle (σ 46 ms), 9 battery banks handled by one edge device, in a hardware-in-the-loop lab test.
Shadow mode: the industrial controller keeps the safety-critical control path and deterministic control of the BESS, while an edge industrial PC receives plant data and returns state estimates, anomaly alerts and analytics.
Shadow mode: the industrial controller keeps the safety-critical control path and deterministic control of the BESS, while an edge industrial PC receives plant data and returns state estimates, anomaly alerts and analytics. Adapted from Goyal, Kumar & Relan, ASME IMECE 2026.
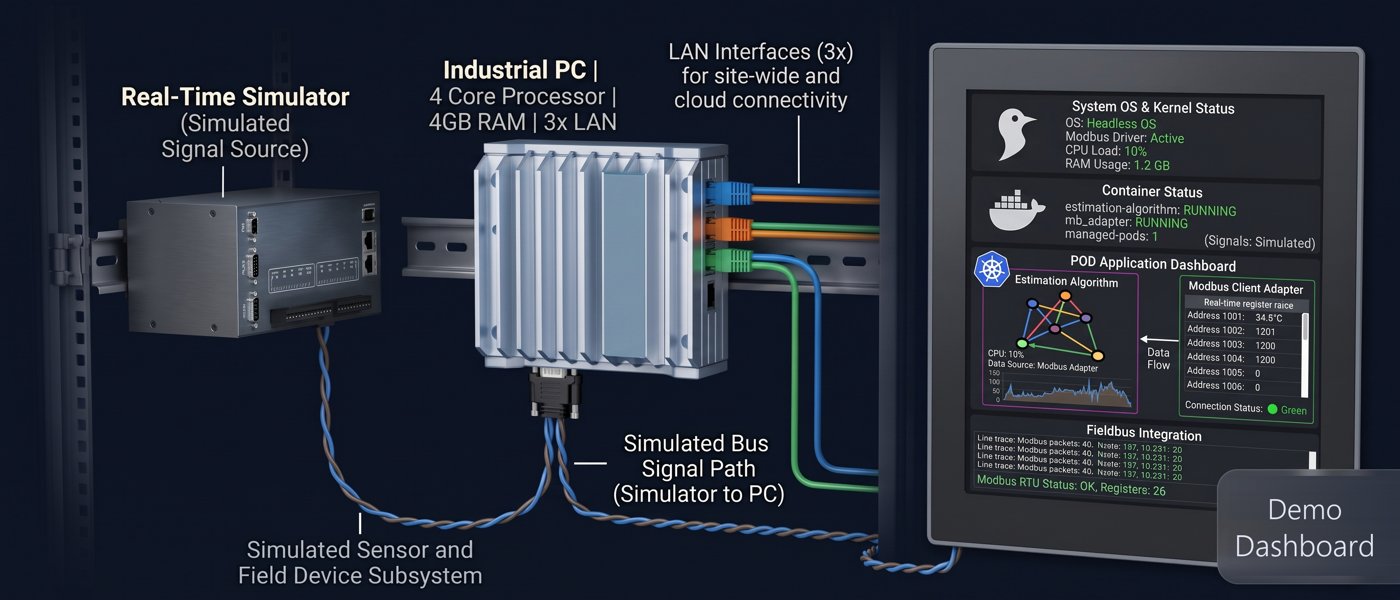
Hardware-in-the-loop demonstrator: a real-time simulator feeds simulated sensor and fieldbus signals to the industrial PC, which runs the containerised estimation algorithm and Modbus adapter (signals simulated).
Hardware-in-the-loop demonstrator: a real-time simulator feeds simulated sensor and fieldbus signals to the industrial PC, which runs the containerised estimation algorithm and Modbus adapter (signals simulated). Adapted from Goyal, Kumar & Relan, ASME IMECE 2026.

Goyal, Kumar & Relan, ASME IMECE 2026

Architecture

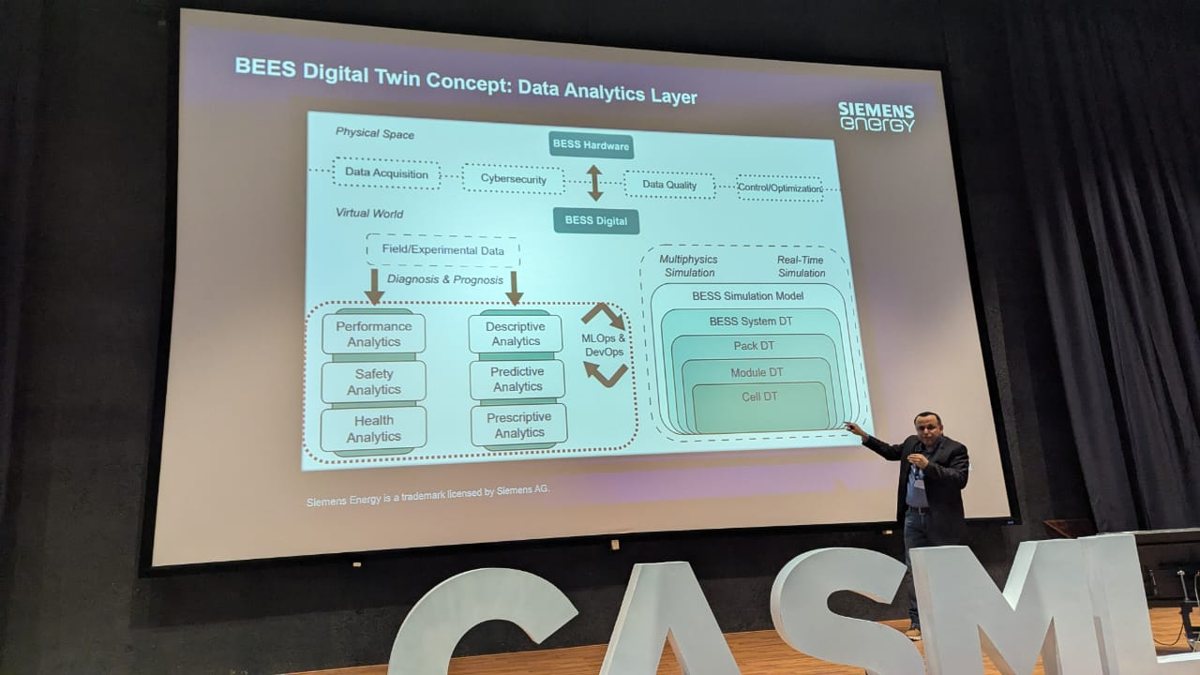
From BESS hardware to a digital-twin ecosystem

Question ·
How do the physical battery and its digital twin fit together as a system of systems?
Approach ·
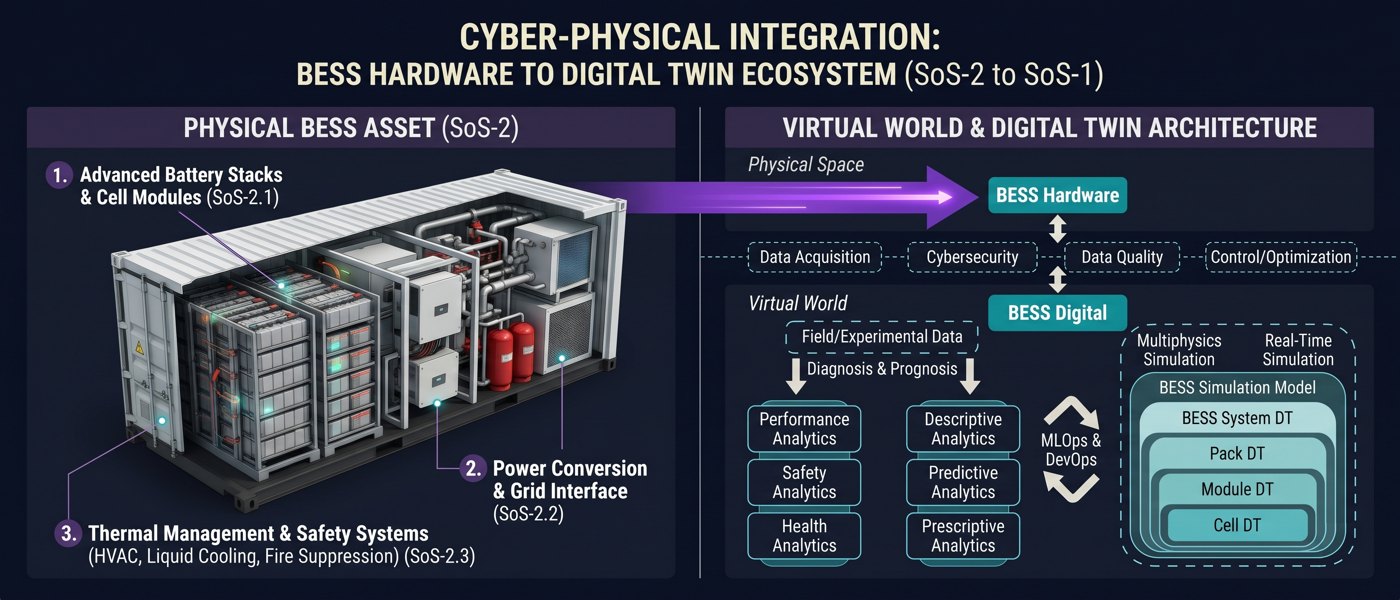
Battery stacks, power conversion and thermal systems mapped to a virtual world of performance, safety and health analytics, with simulation models from cell to system.

Nair et al., CASML 2024 (Spotlight, Honourable Mention)

Cyber-physical integration: the physical BESS asset (battery stacks, power conversion, thermal and safety systems) linked through data acquisition, cybersecurity and data quality to a virtual world of performance, safety and health analytics, MLOps and nested cell-to-system digital twins.
Cyber-physical integration: the physical BESS asset (battery stacks, power conversion, thermal and safety systems) linked through data acquisition, cybersecurity and data quality to a virtual world of performance, safety and health analytics, MLOps and nested cell-to-system digital twins. Adapted from Nair et al., CASML 2024.

Deployment

From raw data to a live dashboard

Question
How does analytics reach operators, reliably and securely?
Approach
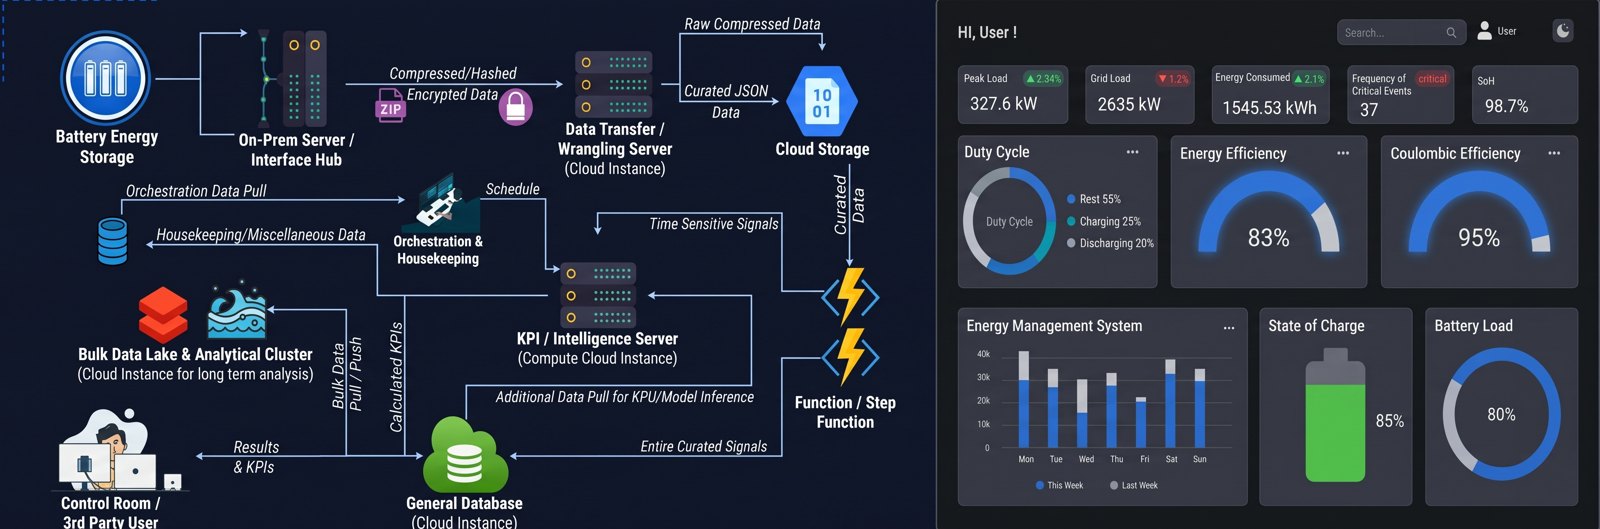
An end-to-end pipeline from the plant’s on-premise server through cloud processing to KPI dashboards.
Deployment architecture — on-premise interface hub, encrypted transfer, cloud storage, orchestration, KPI/intelligence server and data lake — feeding an illustrative operator dashboard of peak load, energy and coulombic efficiency, duty cycle, state of charge and battery load.
Deployment architecture — on-premise interface hub, encrypted transfer, cloud storage, orchestration, KPI/intelligence server and data lake — feeding an illustrative operator dashboard of peak load, energy and coulombic efficiency, duty cycle, state of charge and battery load. Adapted from Goyal et al., ASME IMECE India 2025.

Goyal et al., ASME IMECE India 2025

Question 5 · what should I do?

Health, heat, imbalance and safety become operating decisions: plan duty and maintenance bank by bank, tune cooling, find weak cells and rebalance early, and intervene before a fault spreads — so that each installed cell lasts longer and does more useful work.

Power generation: gas turbines & generators

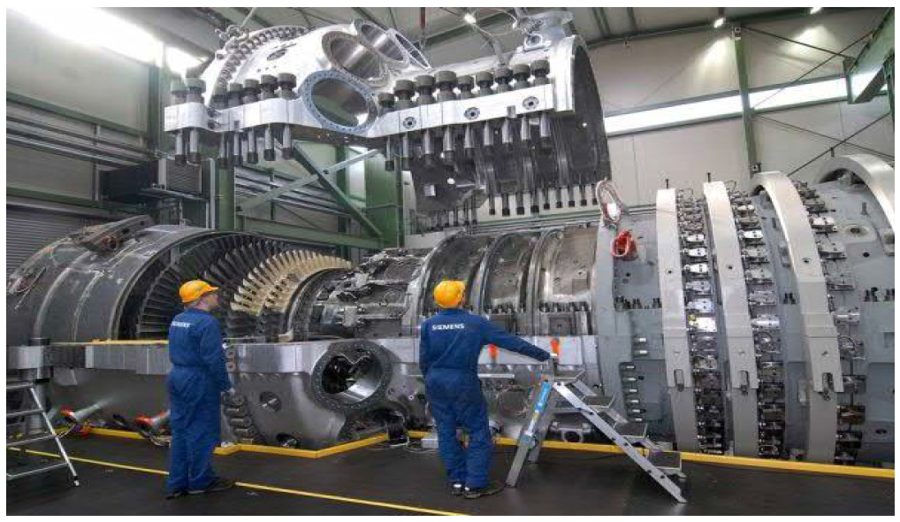
Siemens Energy SGT-8000H large gas turbine
SGT-8000H large gas turbine. Image: Siemens Energy
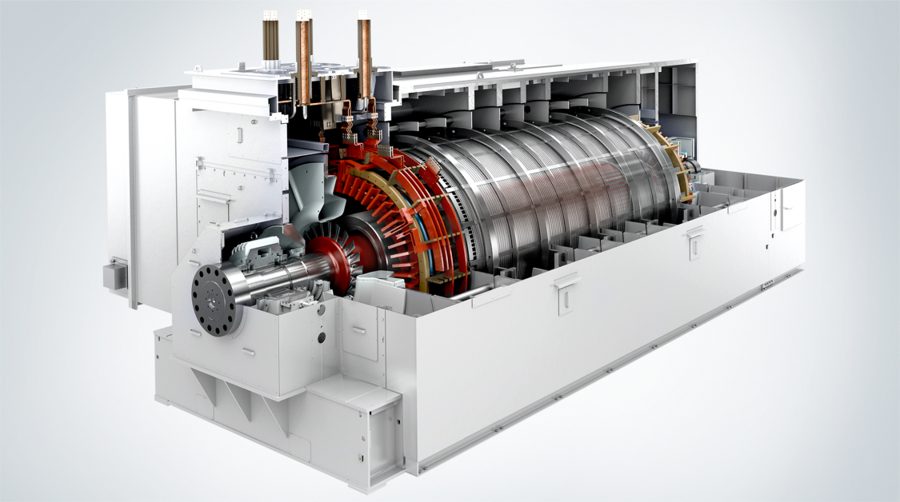
Large turbogenerator, cutaway view
Large turbogenerator. Image: Siemens Energy

Power plants · soft sensing

Turbine-inlet temperature in single-shaft combined-cycle plants

Question ·
Turbine-inlet temperature drives performance and component life, but it cannot be measured directly.
Approach ·
A grey-box soft sensor that combines thermodynamic knowledge with plant data to estimate it.

Nandagopal, More, Relan & Singh, ASME Gas Turbine India Conference 2023

Generators · surrogate modelling

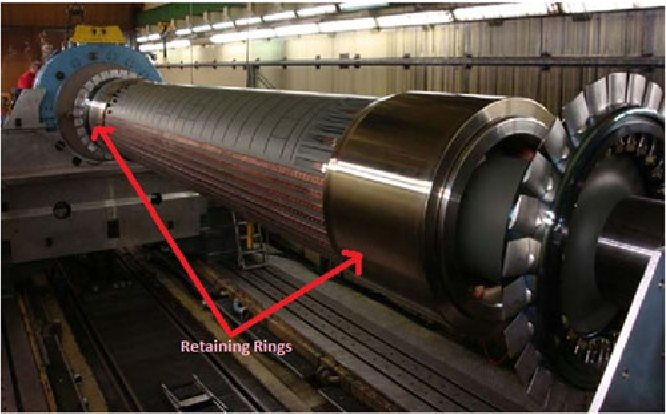
Retaining-ring shrink fit in a turbogenerator

Question
How do you explore the design of a critical rotor component that constrains the end windings, when each finite-element run is expensive?
Approach
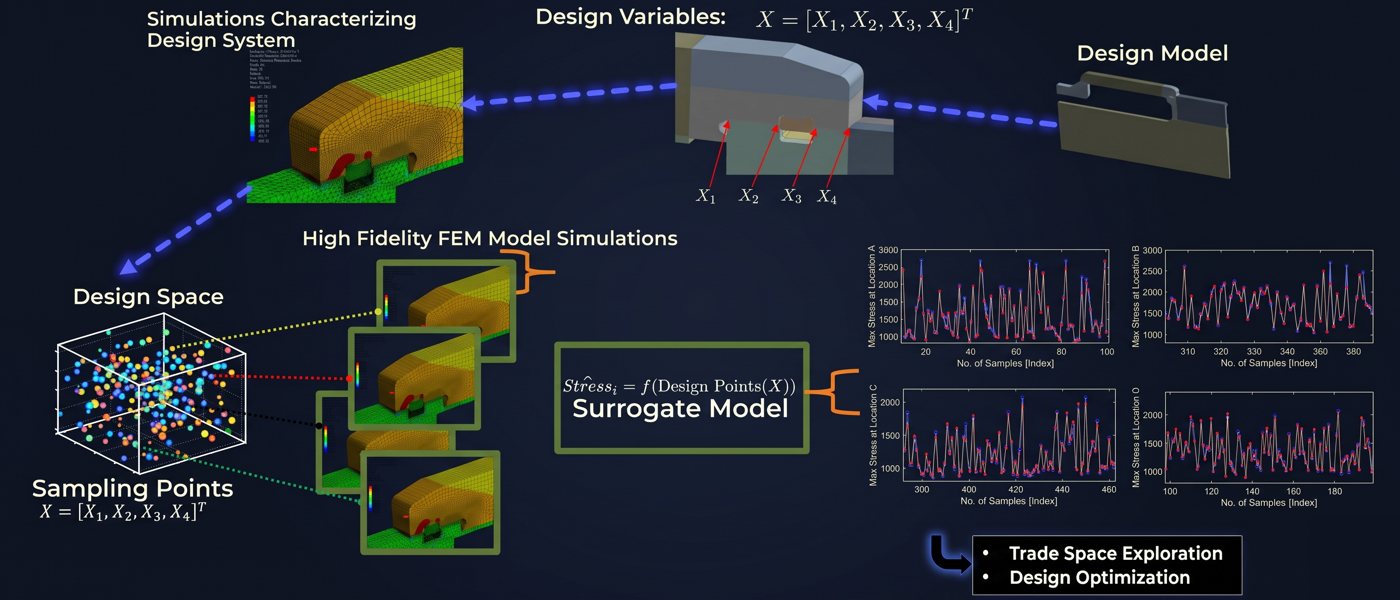
Surrogate models trained on finite-element simulations of the shrink fit, predicting maximum stresses across the design space.
Result
Fast, accurate stress prediction for design exploration — part of the work that made generator design cycles 20× faster.
Turbogenerator rotor: the retaining rings are shrink-fitted over both ends of the rotor winding. Image: Siemens Energy
Surrogate-modelling workflow: design variables X₁–X₄, sampled design space and high-fidelity FEM simulations train a stress surrogate model, whose predictions track the true stresses at four locations — enabling trade-space exploration and design optimisation.
Surrogate-modelling workflow: design variables X₁–X₄, sampled design space and high-fidelity FEM simulations train a stress surrogate model, whose predictions track the true stresses at four locations — enabling trade-space exploration and design optimisation. Adapted from Sharma, Khandelwal & Relan, National Conference on Multidisciplinary Analysis and Optimization 2021.

Sharma, Khandelwal & Relan, National Conference on Multidisciplinary Analysis and Optimization 2021

Gas turbines · digital twin

NDynaROM: fatigue of a large gas-turbine outer casing

Question
Can the low-cycle-fatigue stress of a large gas-turbine casing be predicted for every start-up and shut-down, without running full finite-element analysis each time?
Approach
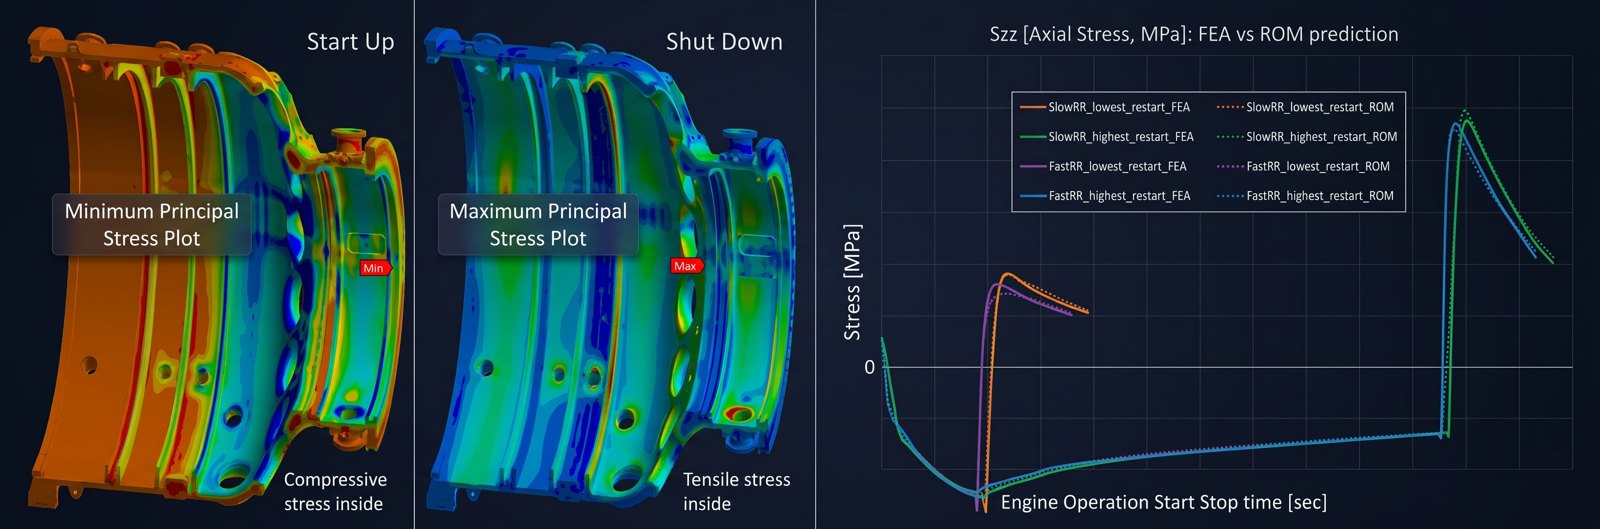
A nonlinear dynamic reduced-order model (NDynaROM), trained on input–output data from transient FEA and built on proper-orthogonal-decomposition modes, then validated on unseen slow and fast load ramps.
Result
The reduced-order model tracks FEA stress on validation data at a fraction of the cost — the core of a dynamic digital twin for predictive maintenance.
Outer-casing FEA: minimum principal stress at start-up (compressive inside) and maximum principal stress at shut-down (tensile inside); right, axial stress from FEA versus the NDynaROM reduced-order model for slow and fast load ramps.
Outer-casing FEA: minimum principal stress at start-up (compressive inside) and maximum principal stress at shut-down (tensile inside); right, axial stress from FEA versus the NDynaROM reduced-order model for slow and fast load ramps. Adapted from Dubey, Relan, Lohse & Szwedowicz, ASME Gas Turbine India Conference 2021. Image: Siemens Energy

Dubey, Relan, Lohse & Szwedowicz, ASME Gas Turbine India Conference 2021

Generators · data-driven testing

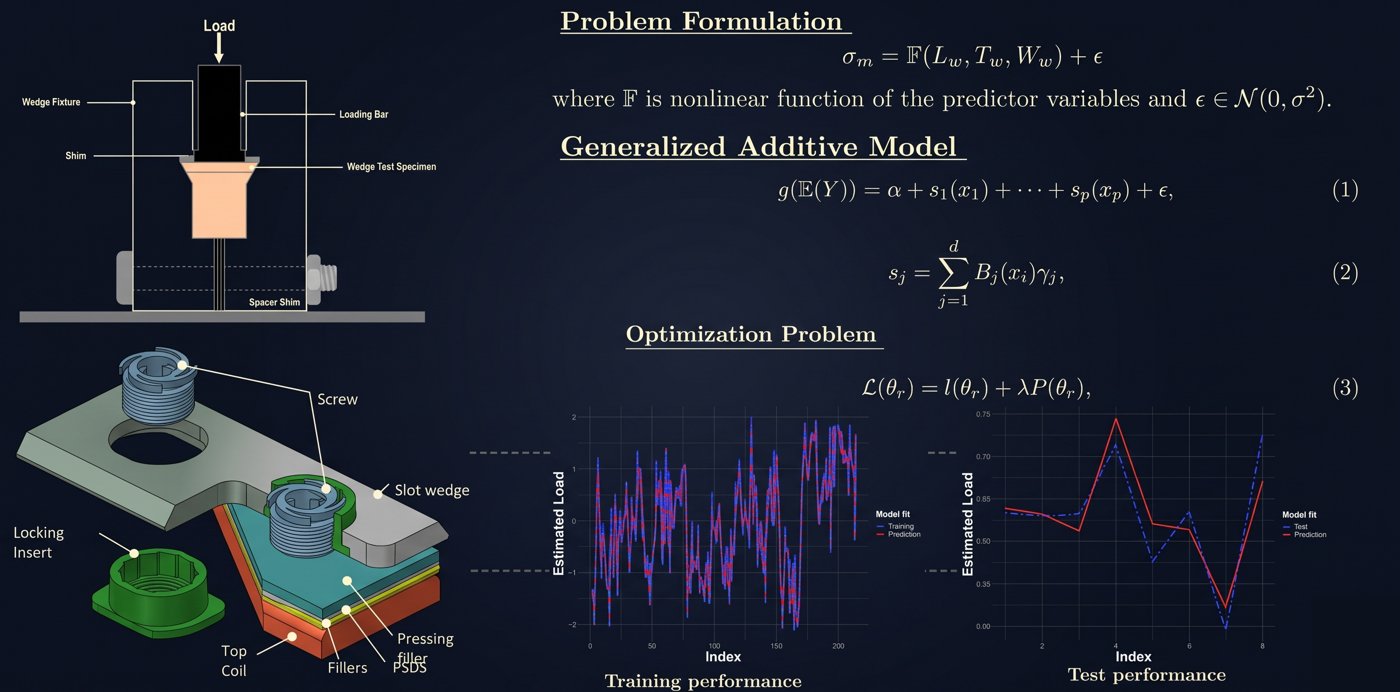
Failure peak shear stress of stator-core slot wedges

Question ·
Can test data predict the failure load of a slot wedge before more physical tests are run?
Approach ·
Data-driven regression models on measurements from a dedicated wedge test fixture.
Result ·
A preliminary industrial case study showing that the failure load can be estimated from test data.

Relan, Titus, Singh & Bais, NCMDAO 2020

Wedge test fixture and retightenable slot-wedge assembly; a generalized additive model of failure load from wedge length, thickness and width, with training and test performance.
Wedge test fixture and retightenable slot-wedge assembly; a generalized additive model of failure load from wedge length, thickness and width, with training and test performance. Adapted from Relan, Titus, Singh & Bais, NCMDAO 2020. Image: Siemens Energy

Gas turbines · prognostics

Fleet-level remaining useful life of hot components

Question
Two identical engines with the same starts and operating hours can have different remaining lives — how do you plan maintenance engine by engine?
Approach
Hierarchical modelling from component to engine to fleet, sharing information across engine classes, with digital-twin models per engine and detection of unknown events.
Result
Individual maintenance plans instead of fixed intervals: lower cost and more fired hours for the customer.
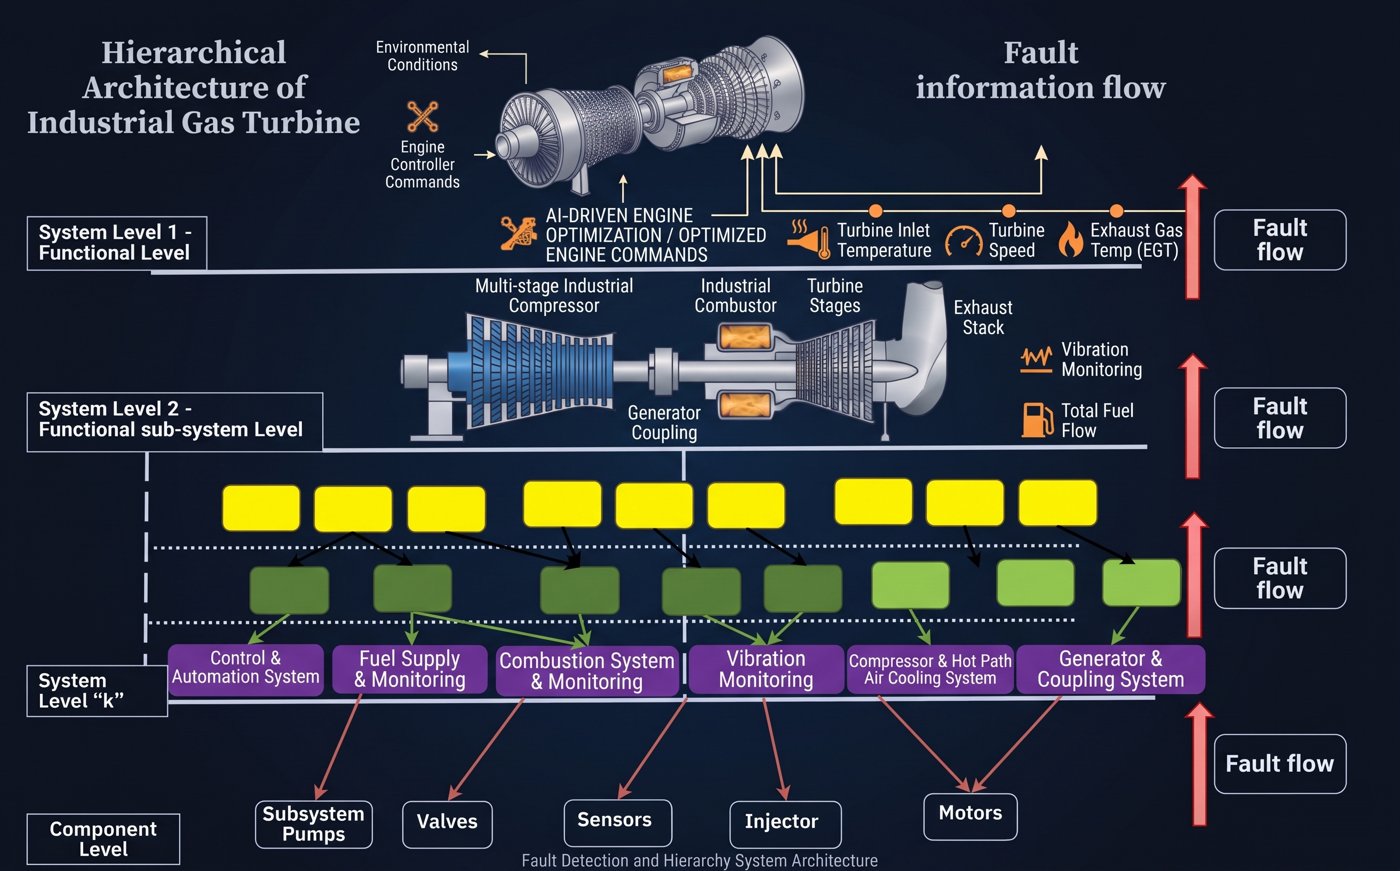
Hierarchical architecture of an industrial gas turbine: faults flow upward from components through subsystems to functional and system level.
Hierarchical architecture of an industrial gas turbine: faults flow upward from components through subsystems to functional and system level. Concept adapted from Zaidan, Relan, Mills & Harrison, Expert Systems with Applications 2015.
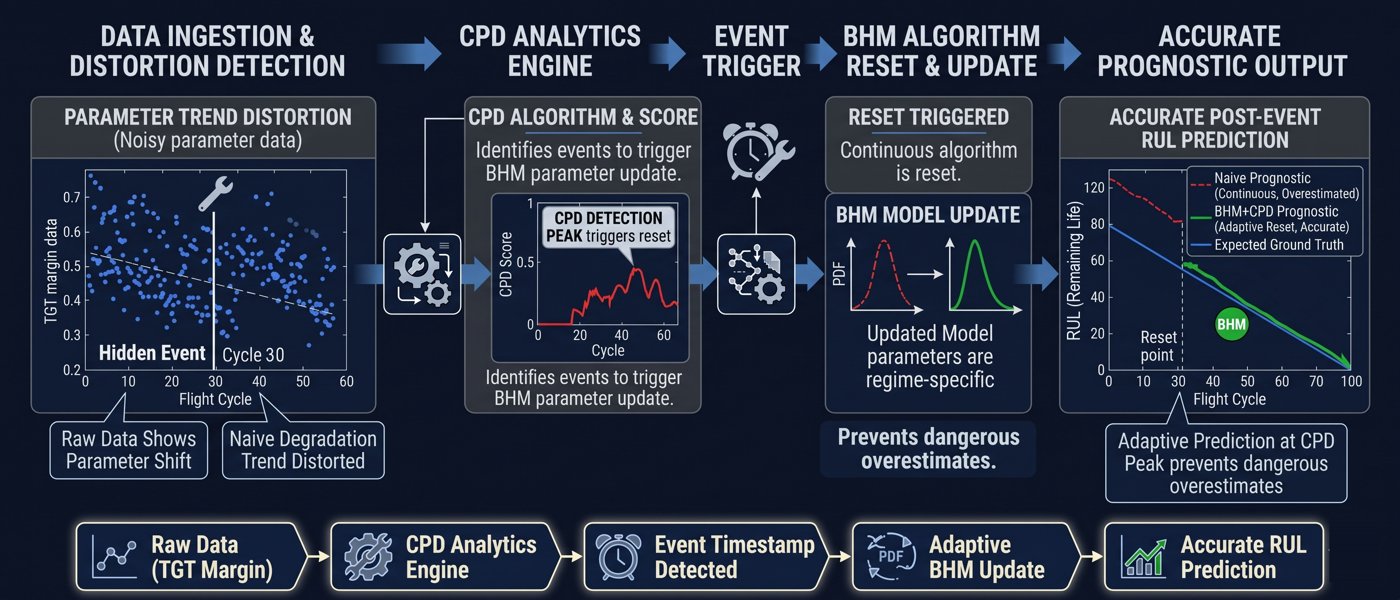
Bayesian hierarchical model (BHM) with change-point detection (CPD): a detected event resets and updates the model, so remaining-useful-life prediction stays accurate instead of dangerously overestimated.
Bayesian hierarchical model (BHM) with change-point detection (CPD): a detected event resets and updates the model, so remaining-useful-life prediction stays accurate instead of dangerously overestimated. Concept adapted from Zaidan, Relan, Mills & Harrison, Expert Systems with Applications 2015.

Concept adapted from Zaidan, Relan, Mills & Harrison, Expert Systems with Applications 2015

Research journey

Seven stages, six countries — the question each one asked, how I approached it and what it taught me.

Click a stage, or use the arrow keys.

Stage 1 of 7 · 2005 – 2006

MSc Mechatronics · industrial research

Hochschule Ravensburg-Weingarten × Tox-Pressotechnik, Germany

“Development and analysis of a non-linear mathematical model for the position control of a pneumo-hydraulic servo system and hardware-in-loop simulations”

Supervisors: Prof. Dr.-Ing. Konrad Wöllhaf, Prof. Dr.-Ing. Holger Voos; industry: Dipl.-Ing. (FH) Albert Rankel

The question ·
How do you position a pneumo-hydraulic press actuator precisely when its physics is strongly nonlinear?
The approach ·
Built a detailed nonlinear Simulink/Stateflow model (orifice flow, several friction models, rate limits, saturation), validated it against measurements on the real system, then designed and tested controllers in real time with hardware-in-the-loop.
What I learned ·
A trustworthy physics model is what makes real-time control on real hardware possible.
Industrial machineryFluid power
Nonlinear physics modellingFriction modelsLinear controlHardware-in-the-loopMATLAB/Simulink & StateflowdSPACE

Then: dSPACE GmbH (2006–08), integrating ESP, ABS and AWD controllers on HIL simulators at GM Europe.

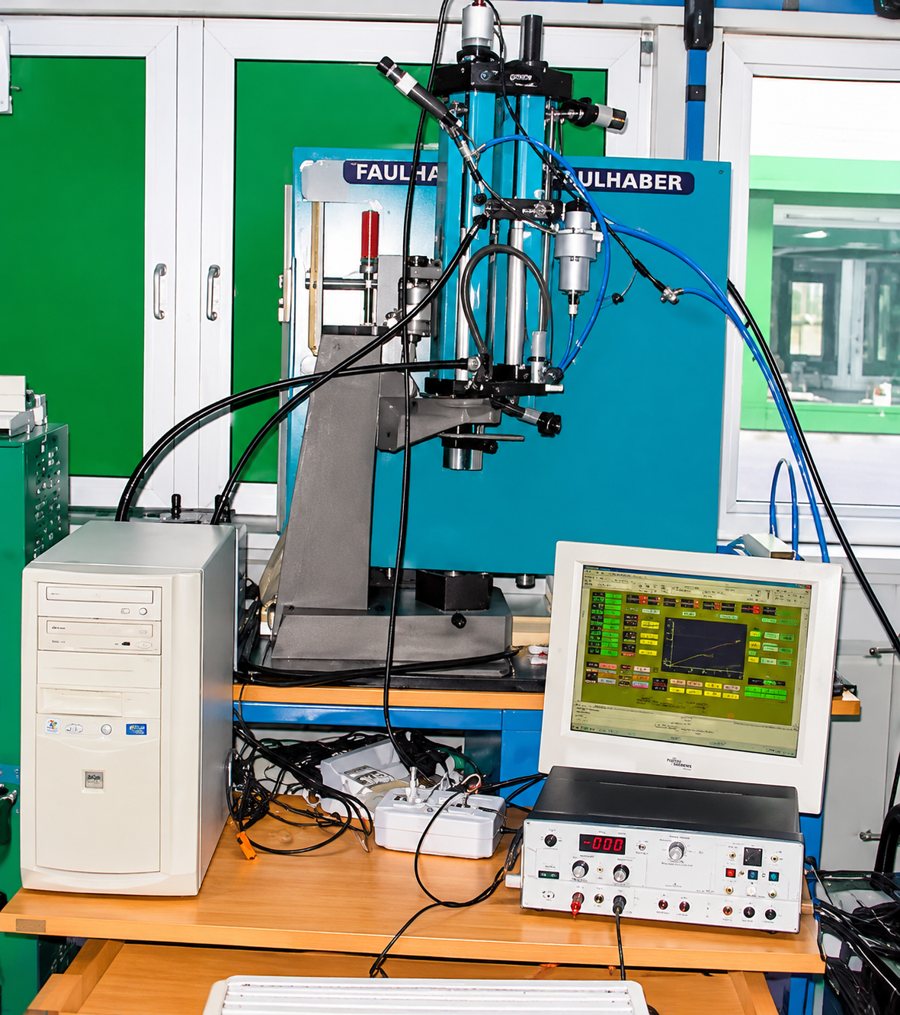
Hardware-in-the-loop test set-up: pneumo-hydraulic press with sensors, real-time controller and operator display.
Hardware-in-the-loop test set-up: pneumo-hydraulic press with sensors, real-time controller and operator display. Adapted from my MSc thesis (Hochschule Ravensburg-Weingarten with Tox-Pressotechnik, 2006).

Stage 2 of 7 · 2008 – 2010

Senior Research Fellow

IIT Delhi, India · DST fellowship

“Active vibration control of rotor-shaft systems using electromagnetic exciters”

The question ·
Can vibrations of a spinning rotor-shaft be suppressed actively, in real time?
The approach ·
Experiment design, simulation and a control framework for rotor-shaft systems actuated by electromagnetic exciters.
What I learned ·
Control is only as good as the experiment that identifies the system — the seed of my later work in system identification.
Rotor dynamicsMechanical vibration
Active vibration controlExperiment designSimulationElectromagnetic actuation
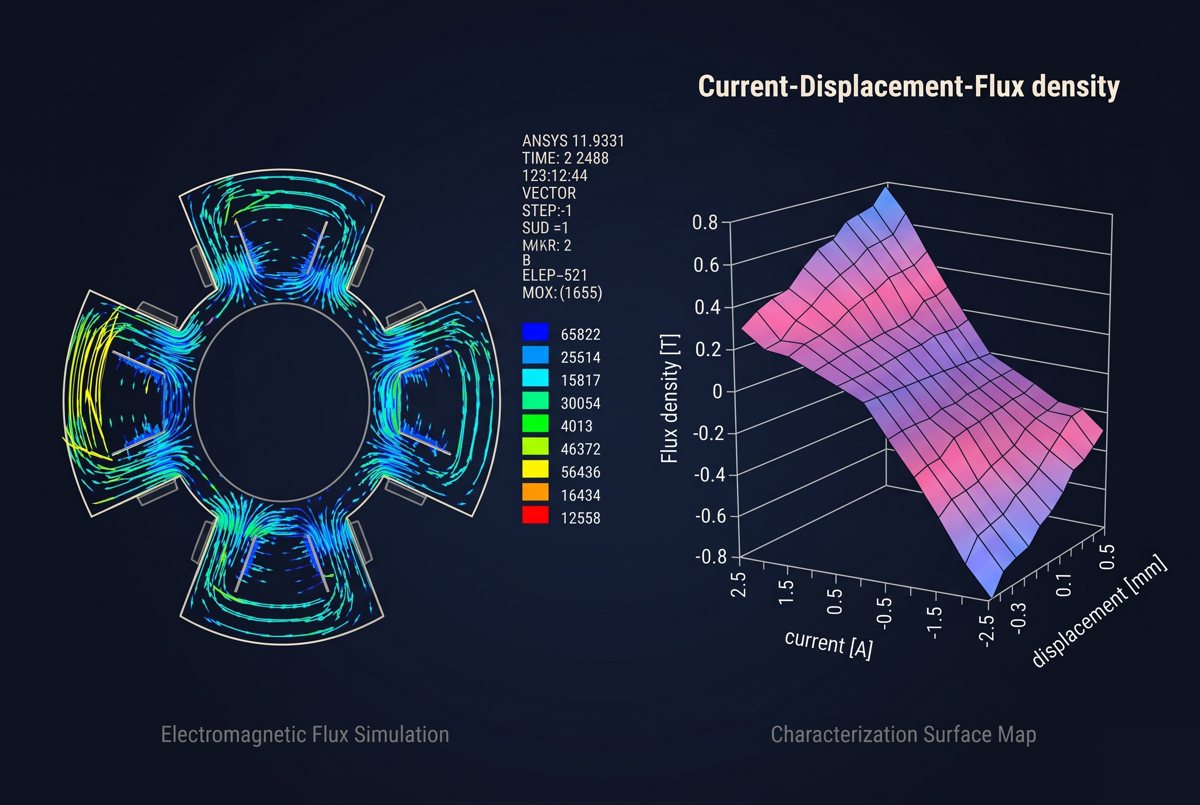
Electromagnetic flux simulation of the exciter and its current–displacement–flux-density characterisation map.
Electromagnetic flux simulation of the exciter and its current–displacement–flux-density characterisation map. Adapted from Das, Relan et al., IUTAM Symposium on Emerging Trends in Rotor Dynamics, 2009.

Stage 3 of 7 · 2010 – 2011

Advanced Master in Artificial Intelligence

KU Leuven, Robotics Lab, Belgium

“Design and implementation of an online estimation skill for a mobile manipulator with force sensor-less manipulation in contact”

Promoter: Prof. Dr. ir. Herman Bruyninckx

The question ·
Can a robot ‘feel’ contact forces when a force sensor is too expensive or impossible to fit — as in telemanipulation or minimally invasive surgery?
The approach ·
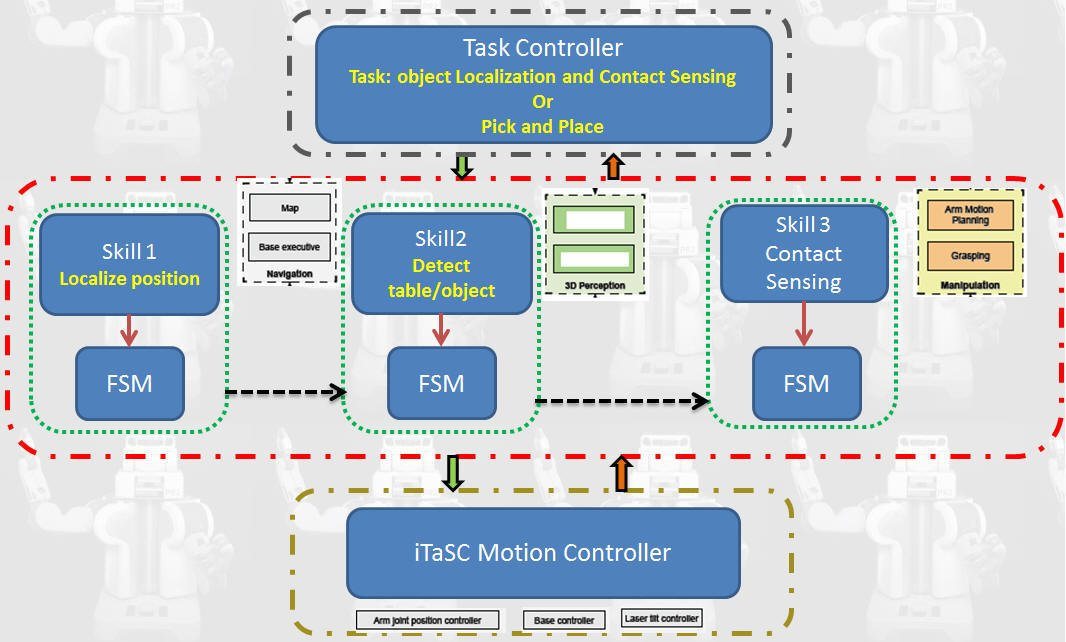
Designed a contact-force estimation skill inside the Task–Skill–Motion control architecture, using an Extended Kalman Filter with contact-dynamics models, and explored particle filters (sequential Monte Carlo) on a mobile manipulator (PR2).
What I learned ·
When you cannot measure it, estimate it — probabilistic estimation can become the sensor.
RoboticsHuman-robot interaction
Extended Kalman FilterParticle filter / sequential Monte CarloContact dynamicsTask-Skill-Motion architectureOROCOS / iTaSC
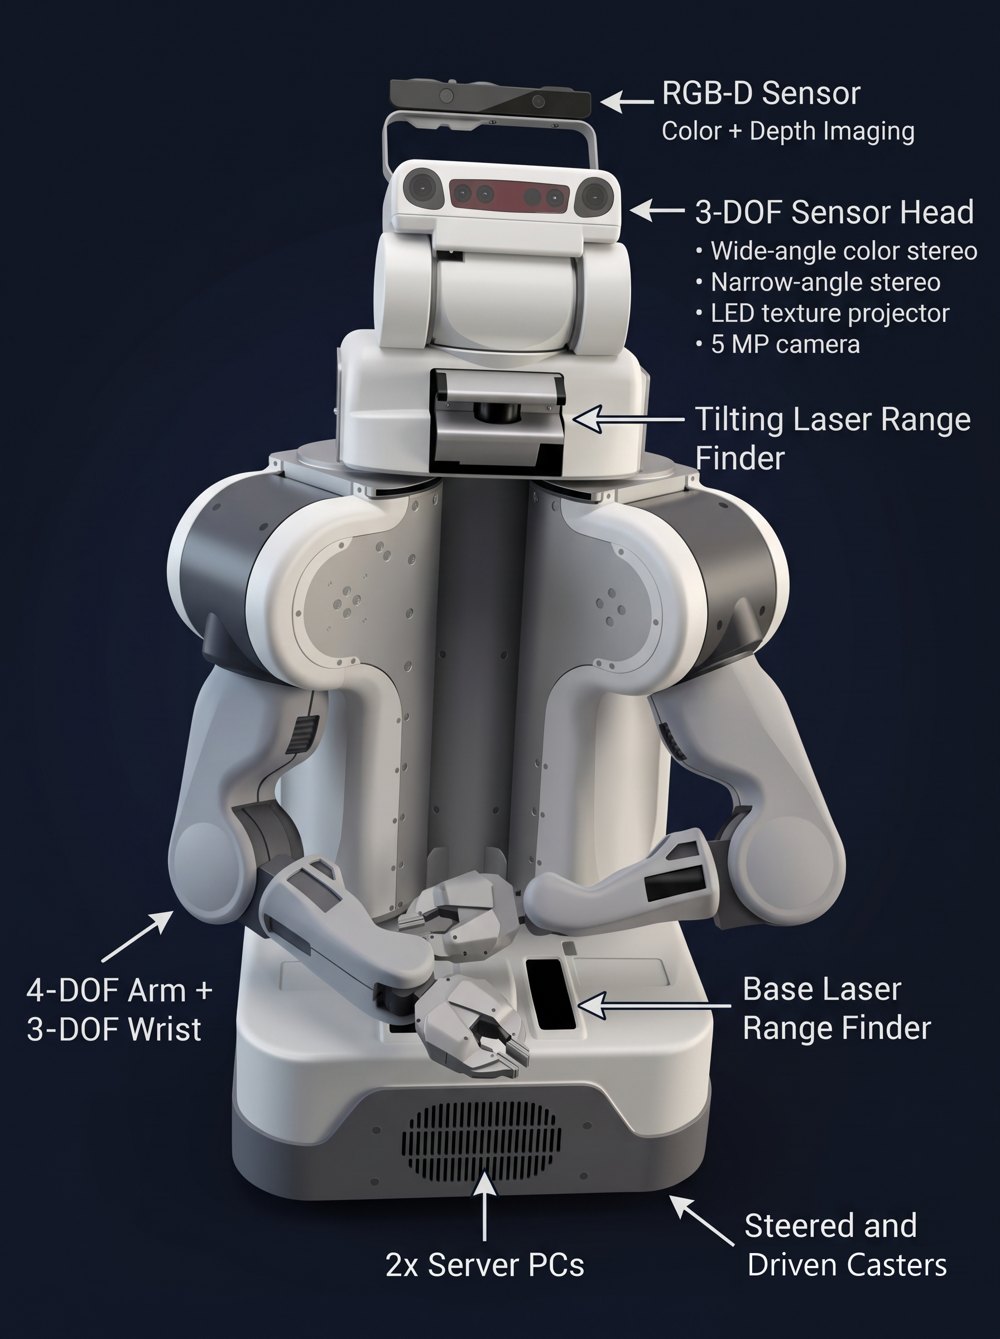
The PR2 mobile manipulator (Willow Garage) used in the thesis: RGB-D and stereo sensor head, tilting and base laser range finders, 4-DOF arms with 3-DOF wrists, and steered, driven casters.
The PR2 mobile manipulator (Willow Garage) used in the thesis: RGB-D and stereo sensor head, tilting and base laser range finders, 4-DOF arms with 3-DOF wrists, and steered, driven casters. Adapted from my MAI thesis (KU Leuven, 2011); PR2 robot by Willow Garage.
Skill architecture for object localisation and contact sensing on the mobile manipulator.
Skill architecture for object localisation and contact sensing on the mobile manipulator. Adapted from my MAI thesis (KU Leuven, 2011).

Stage 4 of 7 · 2012 – 2015

MPhil · Rolls-Royce University Technology Centre

University of Sheffield, Automatic Control & Systems Engineering, UK

“Health monitoring of gas turbine engine: framework design and strategies”

Supervisors: Prof. Visakan Kadirkamanathan, Prof. Robert F. Harrison · funded by the EPSRC–Rolls-Royce Dorothy Hodgkin Postgraduate Award

The question ·
How should an aero engine monitor its own health — which data should it sense, transfer and analyse to catch faults early?
The approach ·
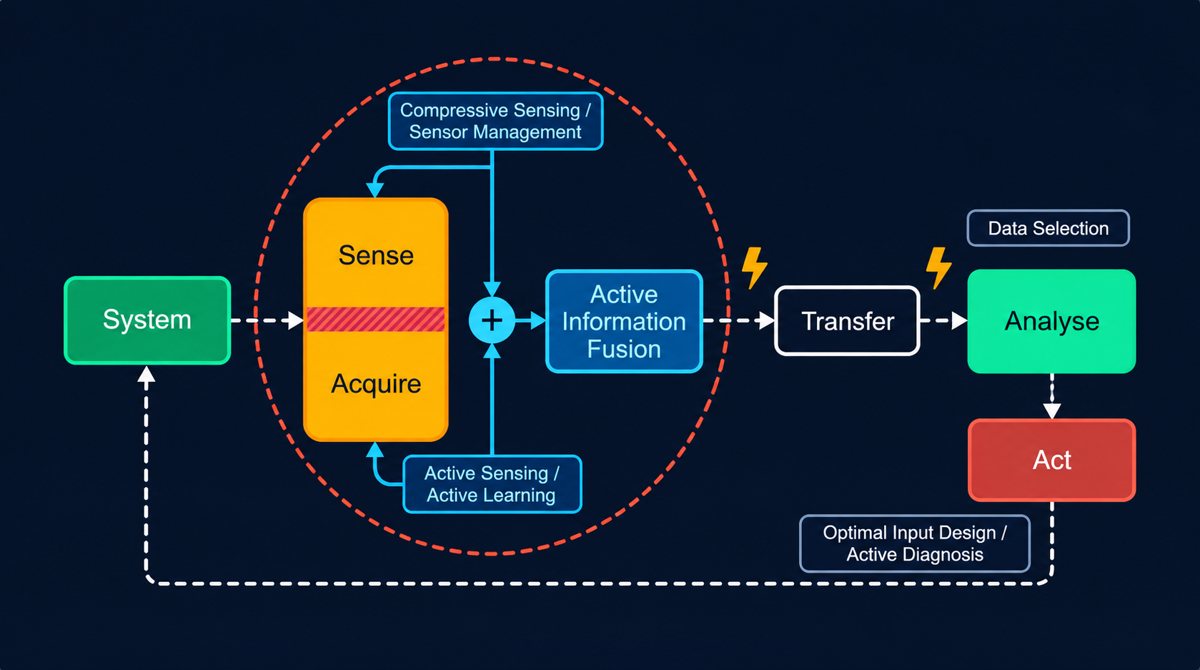
Proposed a Sense–Acquire–Transfer–Analyse–Act health-monitoring framework with compressive sensing, active information fusion and active diagnosis; extracted entropy-based features and detected change points in fuel-metering signals; selected subsystems with FMEA.
What I learned ·
The most informative data often sits in transients — design the data you collect, not just the model.
AerospacePrognostics & health management
Compressed sensingInformation fusionApproximate & spectral entropyChange-point detectionFMEAPrognostics
Active health-monitoring loop: sense and acquire, active information fusion, transfer, analyse and act — with compressive sensing, active learning and optimal input design.
Active health-monitoring loop: sense and acquire, active information fusion, transfer, analyse and act — with compressive sensing, active learning and optimal input design. Adapted from my MPhil thesis (University of Sheffield, 2015).

Stage 5 of 7 · 2013 – 2017

PhD in Engineering Sciences

Vrije Universiteit Brussel (ELEC), Belgium · research visit ETH Zürich

“Data-driven discrete-time identification of continuous-time nonlinear systems and nonlinear modelling of Li-ion batteries”

Supervisor: Prof. Dr. ir. Johan Schoukens · IWT-SBO BATTLE grant

The question ·
How do you build fast, accurate discrete-time models of continuous-time nonlinear systems — and of Li-ion batteries across temperature and state of charge?
The approach ·
Derived discrete-time models with bounded output errors under band-limited assumptions; used multisine experiments, nonparametric best-linear-approximation and nonlinear-distortion analysis, and polynomial nonlinear state-space (PNLSS) models, validated on benchmarks and real battery cells.
What I learned ·
Look at the data in the frequency domain first — it tells you how nonlinear a system really is before you choose a model.

Research visit · ETH Zürich, Automatic Control Laboratory (IfA), Aug–Sep 2016 — frequency domain system identification, hosted by Prof. Roy S. Smith, funded by an FWO research & travel grant.

Li-ion batteriesMeasurement & control
Nonlinear system identificationBest linear approximationLocal polynomial methodPNLSS modelsMultisine excitation designNonparametric distortion analysis
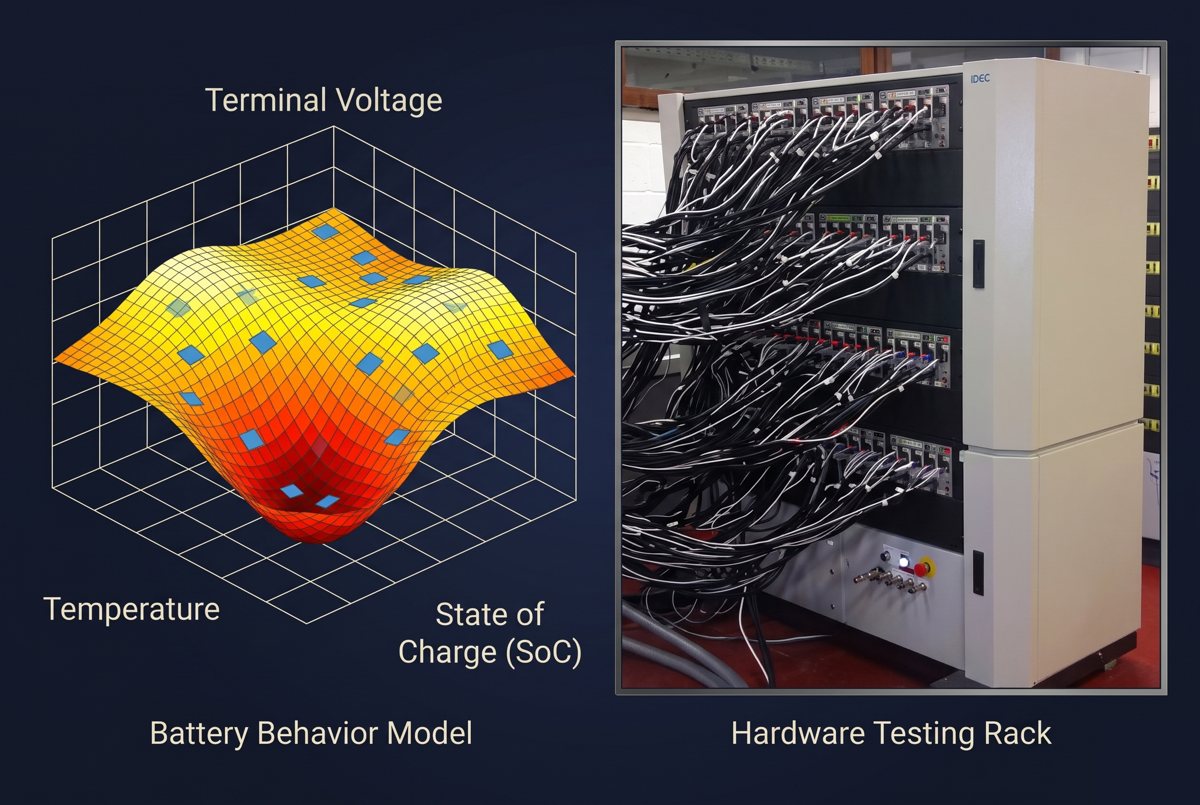
Battery behaviour: terminal voltage over temperature and state of charge, and the hardware testing rack used for the cell experiments.
Battery behaviour: terminal voltage over temperature and state of charge, and the hardware testing rack used for the cell experiments. Adapted from my PhD thesis (Vrije Universiteit Brussel, 2017).
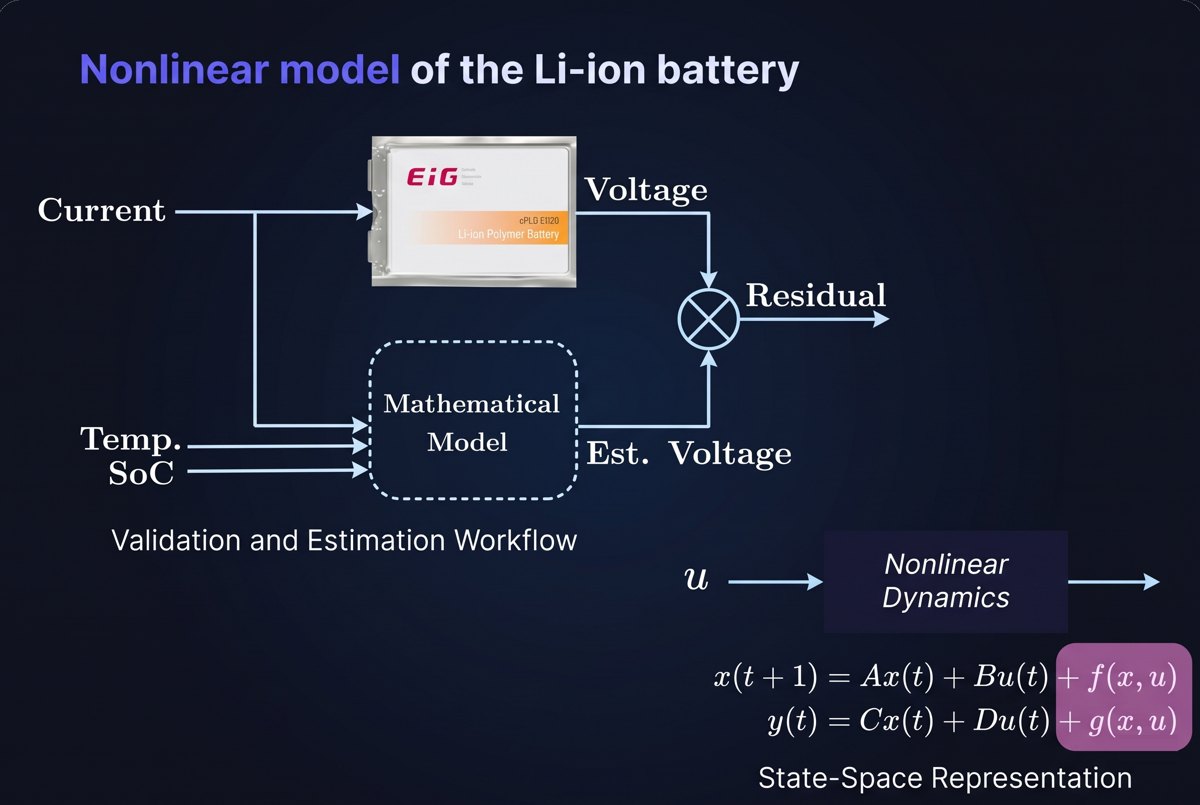
Nonlinear model of the Li-ion battery: current, temperature and state of charge in, estimated voltage out, with a nonlinear state-space structure.
Nonlinear model of the Li-ion battery: current, temperature and state of charge in, estimated voltage out, with a nonlinear state-space structure. Adapted from my PhD thesis (Vrije Universiteit Brussel, 2017).

Stage 6 of 7 · 2017 – 2019

Postdoctoral Researcher

DTU, Denmark · MADE (with Siemens Gamesa) and CITIES

“Stochastic grey-box modelling for energy flexibility and composite manufacturing”

With Prof. Henrik Madsen and colleagues; collaborations with University of Helsinki, Aalto and others

The question ·
How do you model systems that are noisy, partly observed and always changing — from buildings in a smart grid to resin flowing through a wind-blade mould?
The approach ·
Combined physics and data in stochastic grey-box models (stochastic differential equations); characterised the energy flexibility of buildings and designed price and penalty signals; built spatio-temporal flow-front models that cope with missing data.
What I learned ·
Uncertainty is information — model it explicitly instead of averaging it away.
Buildings & smart gridsComposite manufacturingAtmospheric scienceMedical imaging
Stochastic differential equationsGrey-box modellingKalman filteringChange-point detectionBayesian classificationMutual informationGaussian mixtures
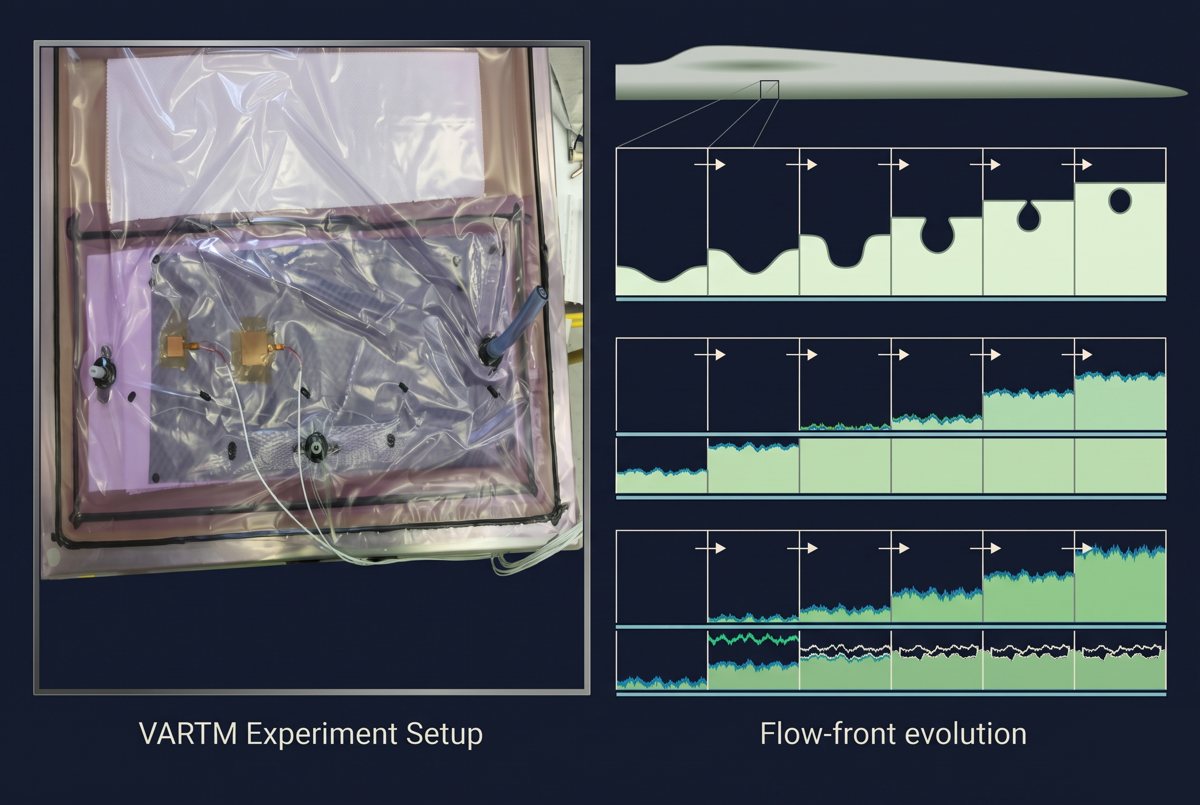
Resin-infusion (VARTM) experiment and flow-front evolution for wind-turbine blade moulding, DTU with Siemens Gamesa (MADE).
Resin-infusion (VARTM) experiment and flow-front evolution for wind-turbine blade moulding, DTU with Siemens Gamesa (MADE). Based on Nauheimer, Relan et al., IFAC-PapersOnLine 51 (2018) and Relan et al., IFAC-PapersOnLine 54 (2021).
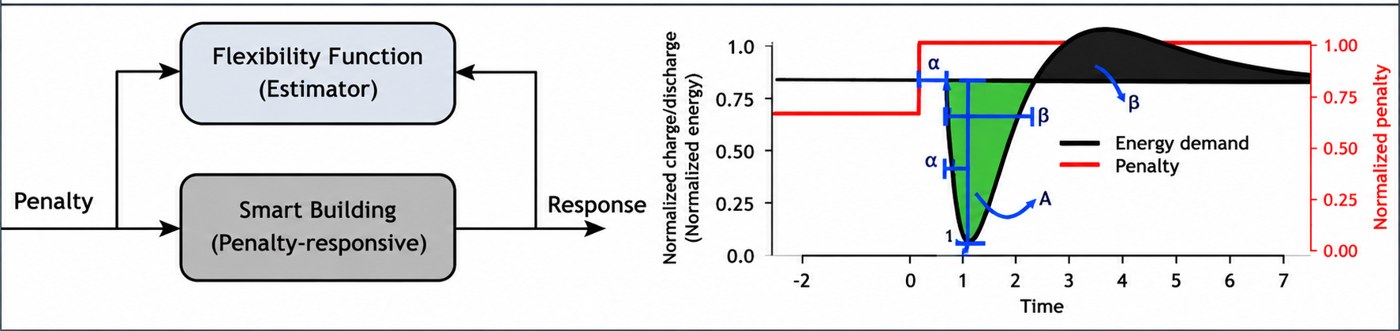
The flexibility function of a penalty-responsive smart building and its step-response characterisation — adapted from Junker, …, Relan et al., Applied Energy 225 (2018), CC BY 4.0

Stage 7 of 7 · 2019 – today

Industrial research & R&D leadership

Siemens / Siemens Energy, India

“Digital twins, surrogate models and AI for power generation and battery energy storage”

Founder of the Battery Advanced AI Technology Lab (BATL)

The question ·
How do you turn models into trusted products that run on real grids and machines?
The approach ·
Surrogate and reduced-order models for generators and gas turbines (design cycles 20× faster), grey-box soft sensors, and AI for battery storage: anomaly detection, state-of-health and ageing prediction, deployed with MLOps.
What I learned ·
Model accuracy is no longer the bottleneck — data orchestration and deployment are. See selected published case studies below
Power generationGrid-scale battery storage
Digital twinsSurrogate modelsGrey-box soft sensorsGaussian-process ensemblesConformal predictionMatrix profileTime-delay embeddingMLOps
Presenting the BESS digital-twin framework, CASML 2024 spotlight, IISc Bengaluru

How I think about digital twins

Five lenses from my talks at ASME IMECE India 2026, the IGSTC Research & Innovation Dialogue Series and SRM University-AP — each linked to the published work that tests it.

Lens 1 of 5

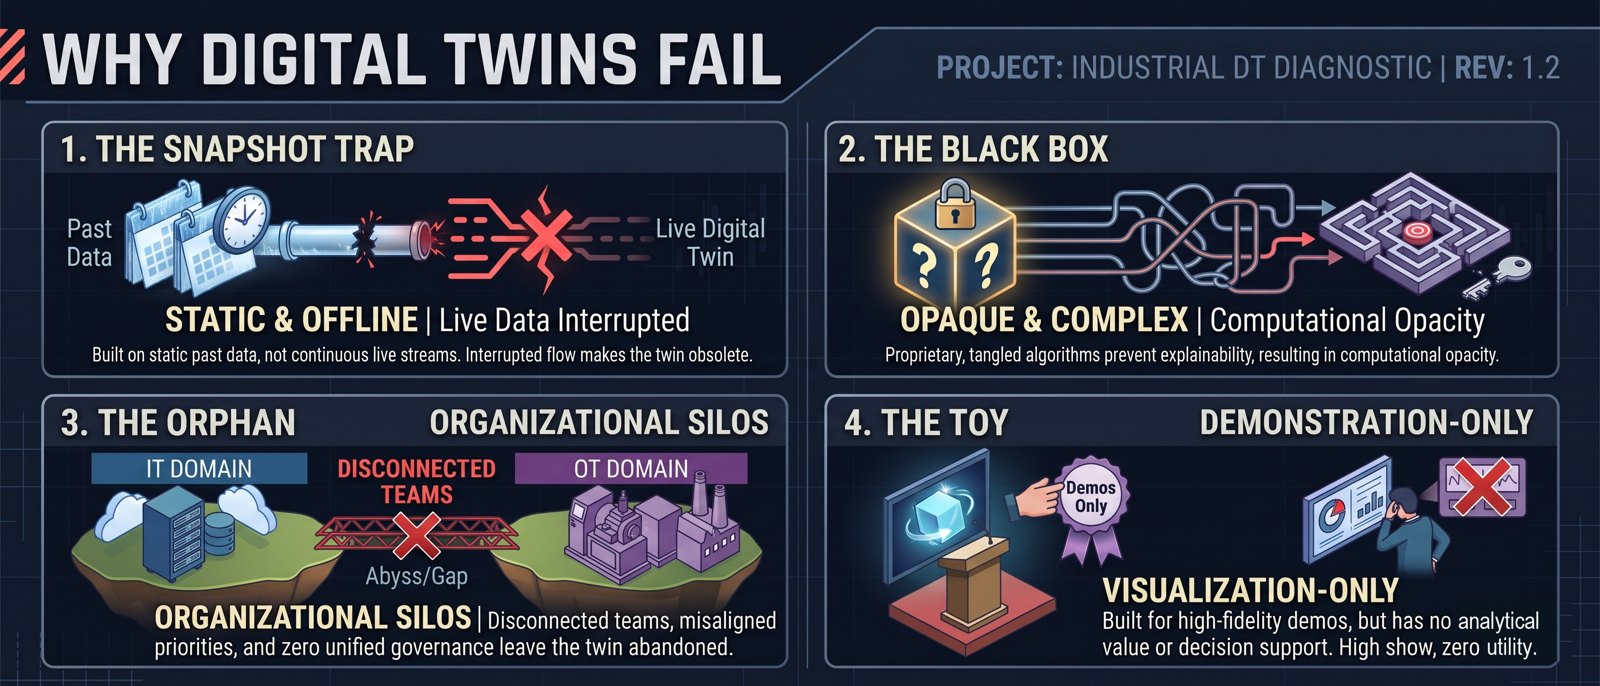
Why twins fail · Four failure modes to design against

Why digital twins fail: the snapshot trap (static and offline), the black box (opaque and complex), the orphan (organisational silos between IT and OT) and the toy (visualisation-only).
Why digital twins fail: the snapshot trap (static and offline), the black box (opaque and complex), the orphan (organisational silos between IT and OT) and the toy (visualisation-only). Adapted from my invited talks at ASME IMECE India 2026 and the IGSTC Research & Innovation Dialogue 2026.

Most digital twins never leave the pilot stage, and they fail in four recognisable ways: a snapshot that stops updating, a black box nobody can explain, an orphan with no owner across IT and OT, or a toy built for the demo. Designing against these four from day one matters more than the choice of model.

Lens 2 of 5

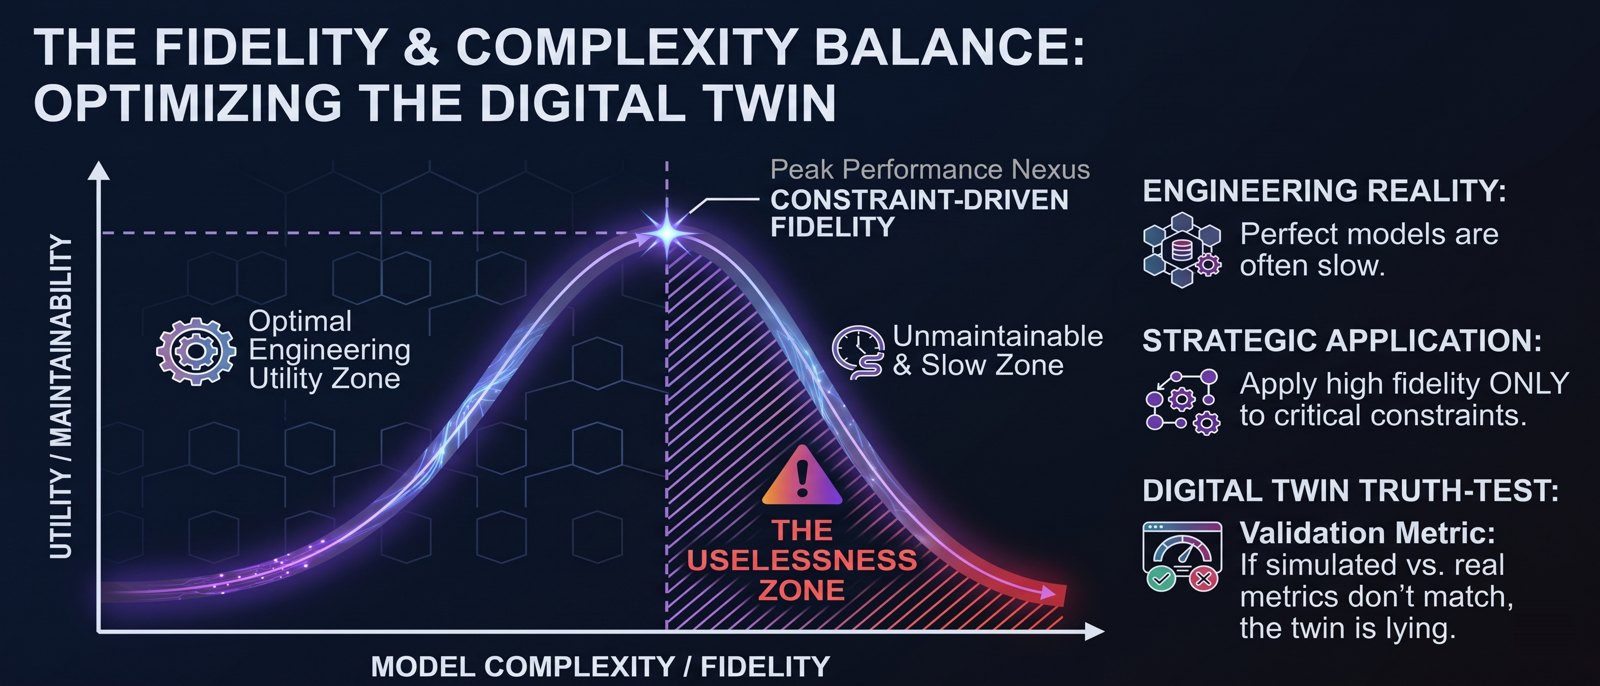
How much model is enough? · Fidelity versus complexity

The fidelity and complexity balance: utility peaks at constraint-driven fidelity; beyond it lies the unmaintainable, slow “uselessness zone”. Apply high fidelity only to critical constraints — and if simulated and real metrics don’t match, the twin is lying.
The fidelity and complexity balance: utility peaks at constraint-driven fidelity; beyond it lies the unmaintainable, slow “uselessness zone”. Apply high fidelity only to critical constraints — and if simulated and real metrics don’t match, the twin is lying. Adapted from my invited talk at ASME IMECE India 2026.

More fidelity is not always better. Past a point, a model becomes slower, harder to maintain and no more useful for the decision at hand — the uselessness zone. I choose the lowest fidelity that answers the operating question, and validate it against measurements.

Lens 3 of 5

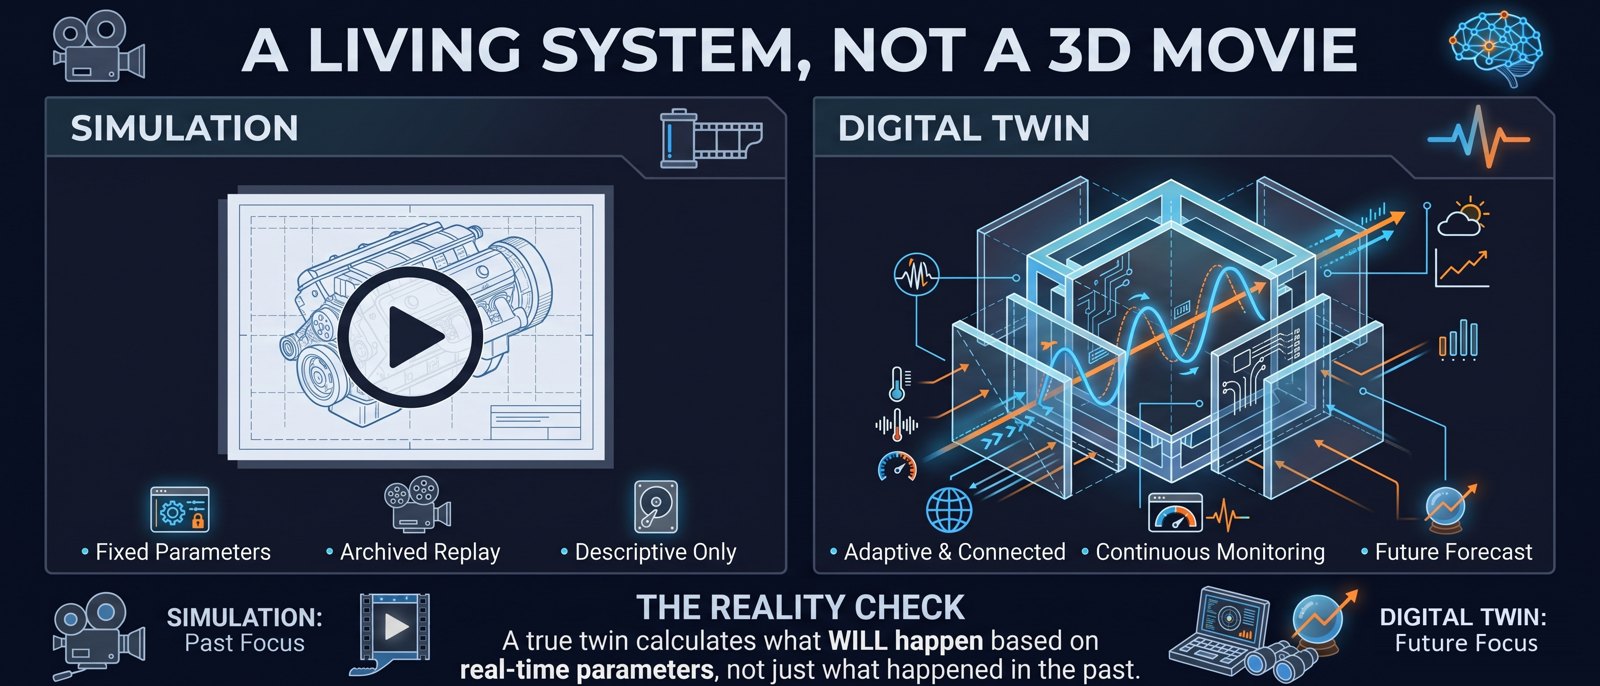
Twin versus simulation · A living system, not a 3D movie

A living system, not a 3D movie: a simulation replays fixed parameters and describes the past; a digital twin is adaptive and connected, monitors continuously and forecasts what will happen, based on real-time parameters.
A living system, not a 3D movie: a simulation replays fixed parameters and describes the past; a digital twin is adaptive and connected, monitors continuously and forecasts what will happen, based on real-time parameters. Adapted from my invited talks on digital twins, 2026.

A simulation replays fixed parameters and the past. A digital twin is fed by live data, updates its own parameters as the asset ages and forecasts what will happen next. Stop calling static models “digital twins.”

Lens 4 of 5

System of systems · Twins layered like the asset

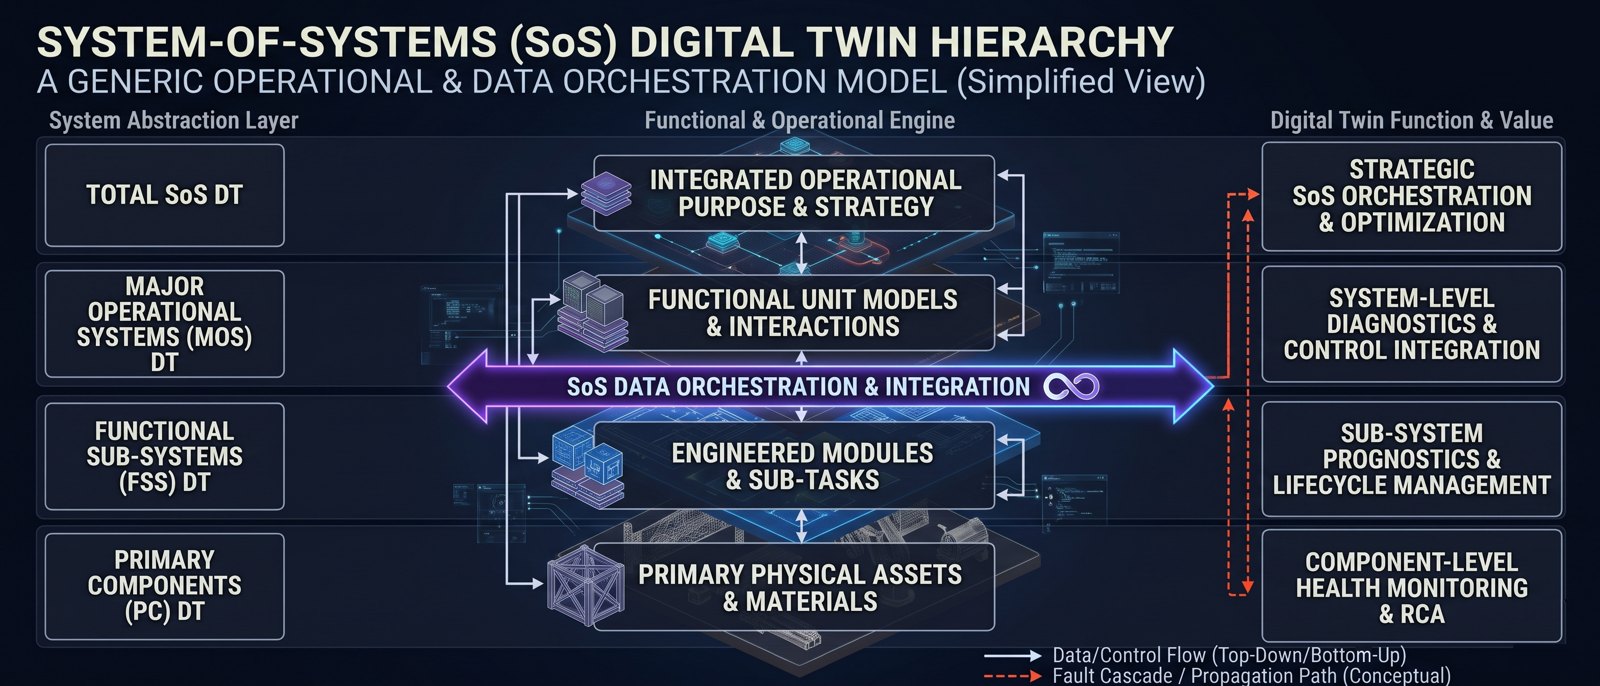
A system-of-systems digital-twin hierarchy: component, sub-system, major-system and total-SoS twins, linked by a data orchestration and integration layer — from component health monitoring and root-cause analysis up to strategic SoS orchestration and optimisation.
A system-of-systems digital-twin hierarchy: component, sub-system, major-system and total-SoS twins, linked by a data orchestration and integration layer — from component health monitoring and root-cause analysis up to strategic SoS orchestration and optimisation. Adapted from my invited talks at ASME IMECE India 2026 and the IGSTC Research & Innovation Dialogue 2026.

Real assets are systems of systems: cells, modules, racks and plant; components, subsystems and engine. Their twins must be layered the same way, with data orchestration between the layers. System-of-systems thinking is no longer optional — it is the only architecture that scales.

Lens 5 of 5

White, grey or black box? · Physics, data — or both

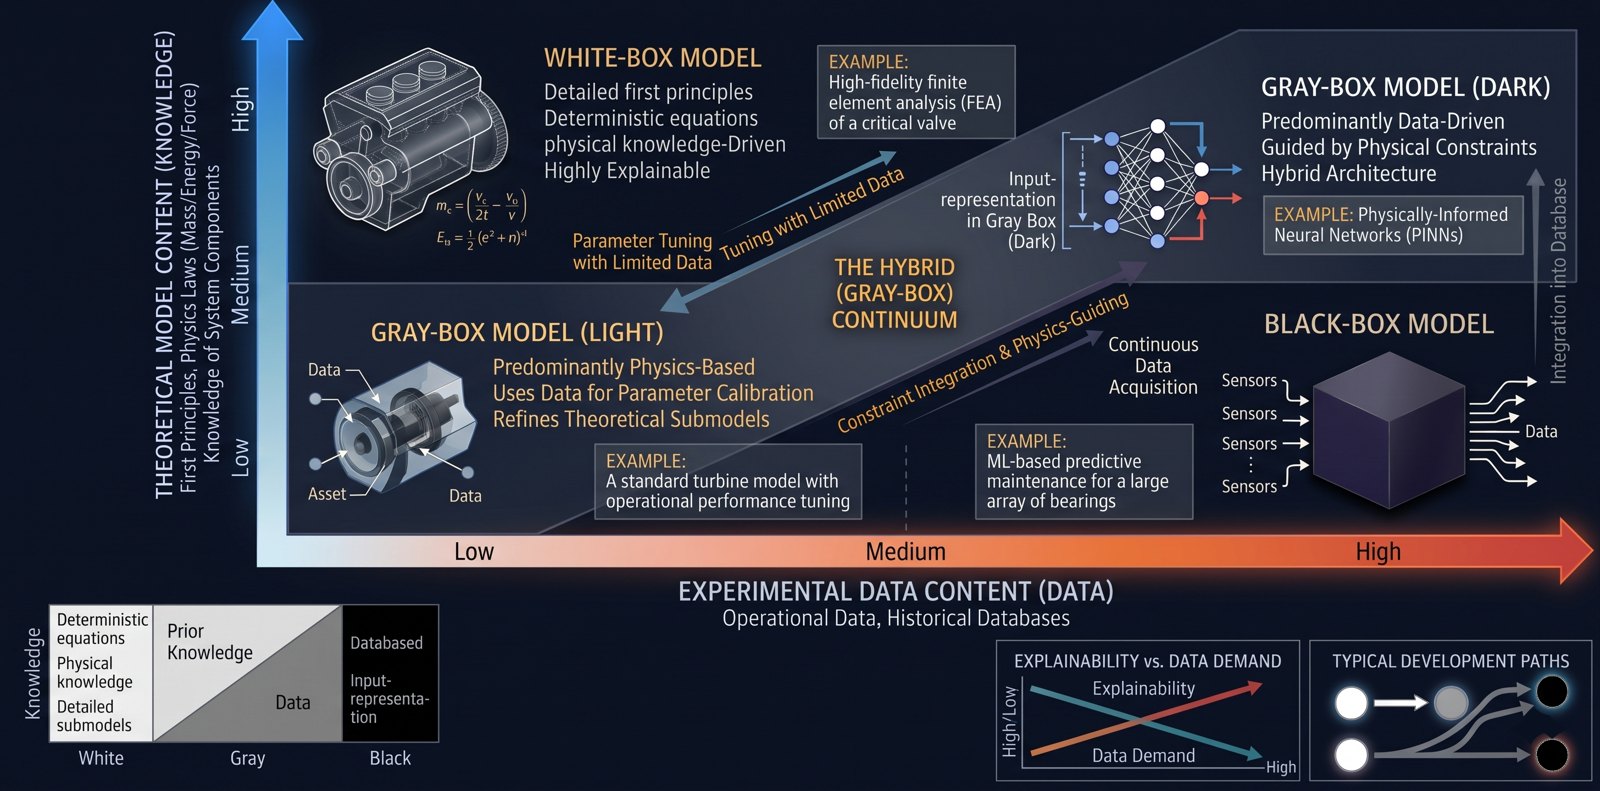
The modelling continuum: white-box (first principles) through light and dark grey-box hybrids to black-box (data-driven) models, set against theoretical knowledge and experimental data, with examples from FEA to physics-informed neural networks.
The modelling continuum: white-box (first principles) through light and dark grey-box hybrids to black-box (data-driven) models, set against theoretical knowledge and experimental data, with examples from FEA to physics-informed neural networks. Adapted from my lecture “Digital Twin and AI: Industry 4.0 Perspective”, SRM University-AP, 2024.
Compare white-, grey- and black-box twins in detail

White-box twin

Based on physics

  • Mostly deterministic, time-consuming to build
  • Parameters have physical meaning
  • Usually no handling of noise
  • The whole machinery of control theory and dynamical systems becomes available
  • Good for realistic simulations

Grey-box twin

Bridges the gap between data and physics

  • Stochastic, relatively fast
  • Parameters may or may not have physical meaning
  • Systematic handling of uncertainty through the diffusion term of stochastic differential equations
  • Many statistical, mathematical and physical methods for validation and structure modification
  • Good for realistic simulations

Black-box twin

Based on data

  • Stochastic, fast to identify
  • Parameters seldom have physical meaning
  • Multiple frameworks for noise handling (output error, errors-in-variables)
  • The whole machine-learning and statistics machinery becomes available
  • Not suitable for high-dimensional control problems

From my lecture “Digital Twin and AI: Industry 4.0 Perspective”, SRM University-AP, 2024.

Physics-based (white-box) twins are interpretable but slow to build and blind to noise; data-driven (black-box) twins are fast but rarely explain themselves. Grey-box twins bridge the gap — stochastic differential equations carry the physics and handle uncertainty explicitly. This thread runs from my PhD and DTU work to today’s soft sensors.

Before connecting any model to any asset, agree four things

  1. 1Timing

    How fast must it run? The physics of the asset sets it.

  2. 2Data contract

    Type, scale, units and range, agreed by both sides.

  3. 3Result validity

    How long is a result fresh? When is it stale?

  4. 4Failure policy

    What happens when the link drops or the device restarts?

The same four questions, different answers — for batteries, gas turbines, transformers, electrolysers or compressors. Tested on batteries in the lab (Goyal, Kumar & Relan, ASME IMECE 2026).

  • System-of-Systems thinking is no longer optional — it’s the only architecture that scales.
  • Stop calling static models “digital twins.”
  • Fleet priors + anomaly detection are how RUL prediction matures from art to engineering.
  • The debate over AI in critical assets is over — the evidence is in hardware.
  • Model accuracy stopped being the bottleneck. Data orchestration is.
  • The question is no longer whether digital twins work. It’s who builds the orchestration layer first.

“The next decade will be decided between the boxes.”

Fields × methods

The same toolbox, applied across very different physical systems.

Methods used across application fields
Industrial machineryRotor dynamicsRoboticsAerospaceLi-ion & BESSBuildings & gridsCompositesPower generationAtmospheric scienceMedical & bio
Physics-based modelling
Control & hardware-in-the-loop
Kalman & particle filters
Nonlinear system identification
Stochastic grey-box (SDE) models
Frequency-domain analysis (BLA)
Entropy & information theory
Bayesian & ML classification
Gaussian processes & probabilistic prediction
Change-point & anomaly detection
Surrogate models & digital twins

Patents & IP

  • Trade secret · AI-driven system for efficient compression, transmission and storage of large-scale time-series data in BESS (Siemens AG, accepted by Siemens Energy AG)
  • Invention disclosure · Battery efficiency computation from live data streams with dynamic region detection (transferred to Siemens Energy AG)
  • Invention disclosure · Probabilistic anomaly detection and data-quality assessment for BESS (transferred to Siemens Energy AG)

Fellowships & funding

  • Dorothy Hodgkin Postgraduate Award · Engineering and Physical Sciences Research Council (EPSRC) & Rolls-Royce plc, UK (MPhil)
  • Doctoral fellowship · Vrije Universiteit Brussel (VUB), BATTLE project — Strategic Basic Research (SBO) grant of Flanders Innovation & Entrepreneurship (VLAIO, formerly IWT), Belgium (2013–17)
  • Postdoctoral fellowship · Technical University of Denmark (DTU), Manufacturing Academy of Denmark (MADE), Centre for IT-Intelligent Energy Systems in Cities (CITIES), Denmark (2017–19)
  • Senior Research Fellowship · Department of Science and Technology, Government of India (DST) & Indian Institute of Technology Delhi (2008–10)
  • Travel & research-visit awards · Research Foundation – Flanders (FWO; ETH Zürich visit), Otto Mønsteds Fond (Denmark), Vrije Universiteit Brussel (VUB), Hausdorff Research Institute for Mathematics (HIM), Hausdorff Center for Mathematics (HCM), European Embedded Control Institute (EECI), UK-India Education and Research Initiative (UKIERI)

Reviewing & service

  • Remote reviewer · European Research Council (ERC) Starting Grant 2020
  • Expert industry reviewer · ASME India courses (robotics & industrial robotic systems)
  • Jury member · Smart India Hackathon 2020
  • ERNSI · contributor to the European Research Network on System Identification

Past research collaborations & visits

Aug – Sep 2016

ETH Zürich · Visiting Researcher

Frequency domain system identification. Hosted by Prof. Roy S. Smith at the Automatic Control Laboratory (IfA). Fully sponsored by a research and travel grant from the FWO (Research Foundation – Flanders).

Apr – Jun 2013

Vrije Universiteit Brussel · Visiting Researcher

With Prof. Johan Schoukens and Prof. Rik Pintelon.

ETH ZürichDTUUniversity of HelsinkiAalto UniversityKU Leuven / EnergyVilleNTNUNOVA LisbonTU EindhovenVrije Universiteit BrusselUniversity of SheffieldRolls-Royce UTCHausdorff Center (Bonn)IIT DelhiIISc BengaluruBML Munjal UniversitySRM University-APIIT BombayFraunhofer FOKUSCIMNE (Spain)Siemens Gamesa

Research collaboration?

Joint research, industry-academia projects, PhD co-supervision and juries, reviewing or advisory roles — tell me about your idea.

  • Themes: battery AI & BESS, digital twins, nonlinear system identification, stochastic grey-box modelling, energy flexibility.
  • Students & universities: industry thesis projects, guest lectures and curriculum input — see teaching formats.
  • Prefer email? rishirelan@gmail.com

About the figures. Figures on this page are adapted, redrawn or simplified from my own publications, theses and conference presentations, and from public sources; each caption names its source where known. Images marked Siemens Energy remain the property of Siemens Energy. Figures from journal articles remain © their publishers or are reused under their stated licence (e.g. CC BY 4.0). Some values are normalised or shown qualitatively for confidentiality, and figures may differ in detail from the originals — for exact results, please refer to the original publications. Product names and trademarks belong to their respective owners.